## Trajectory Plots: Token Embeddings in PCA Space
### Overview
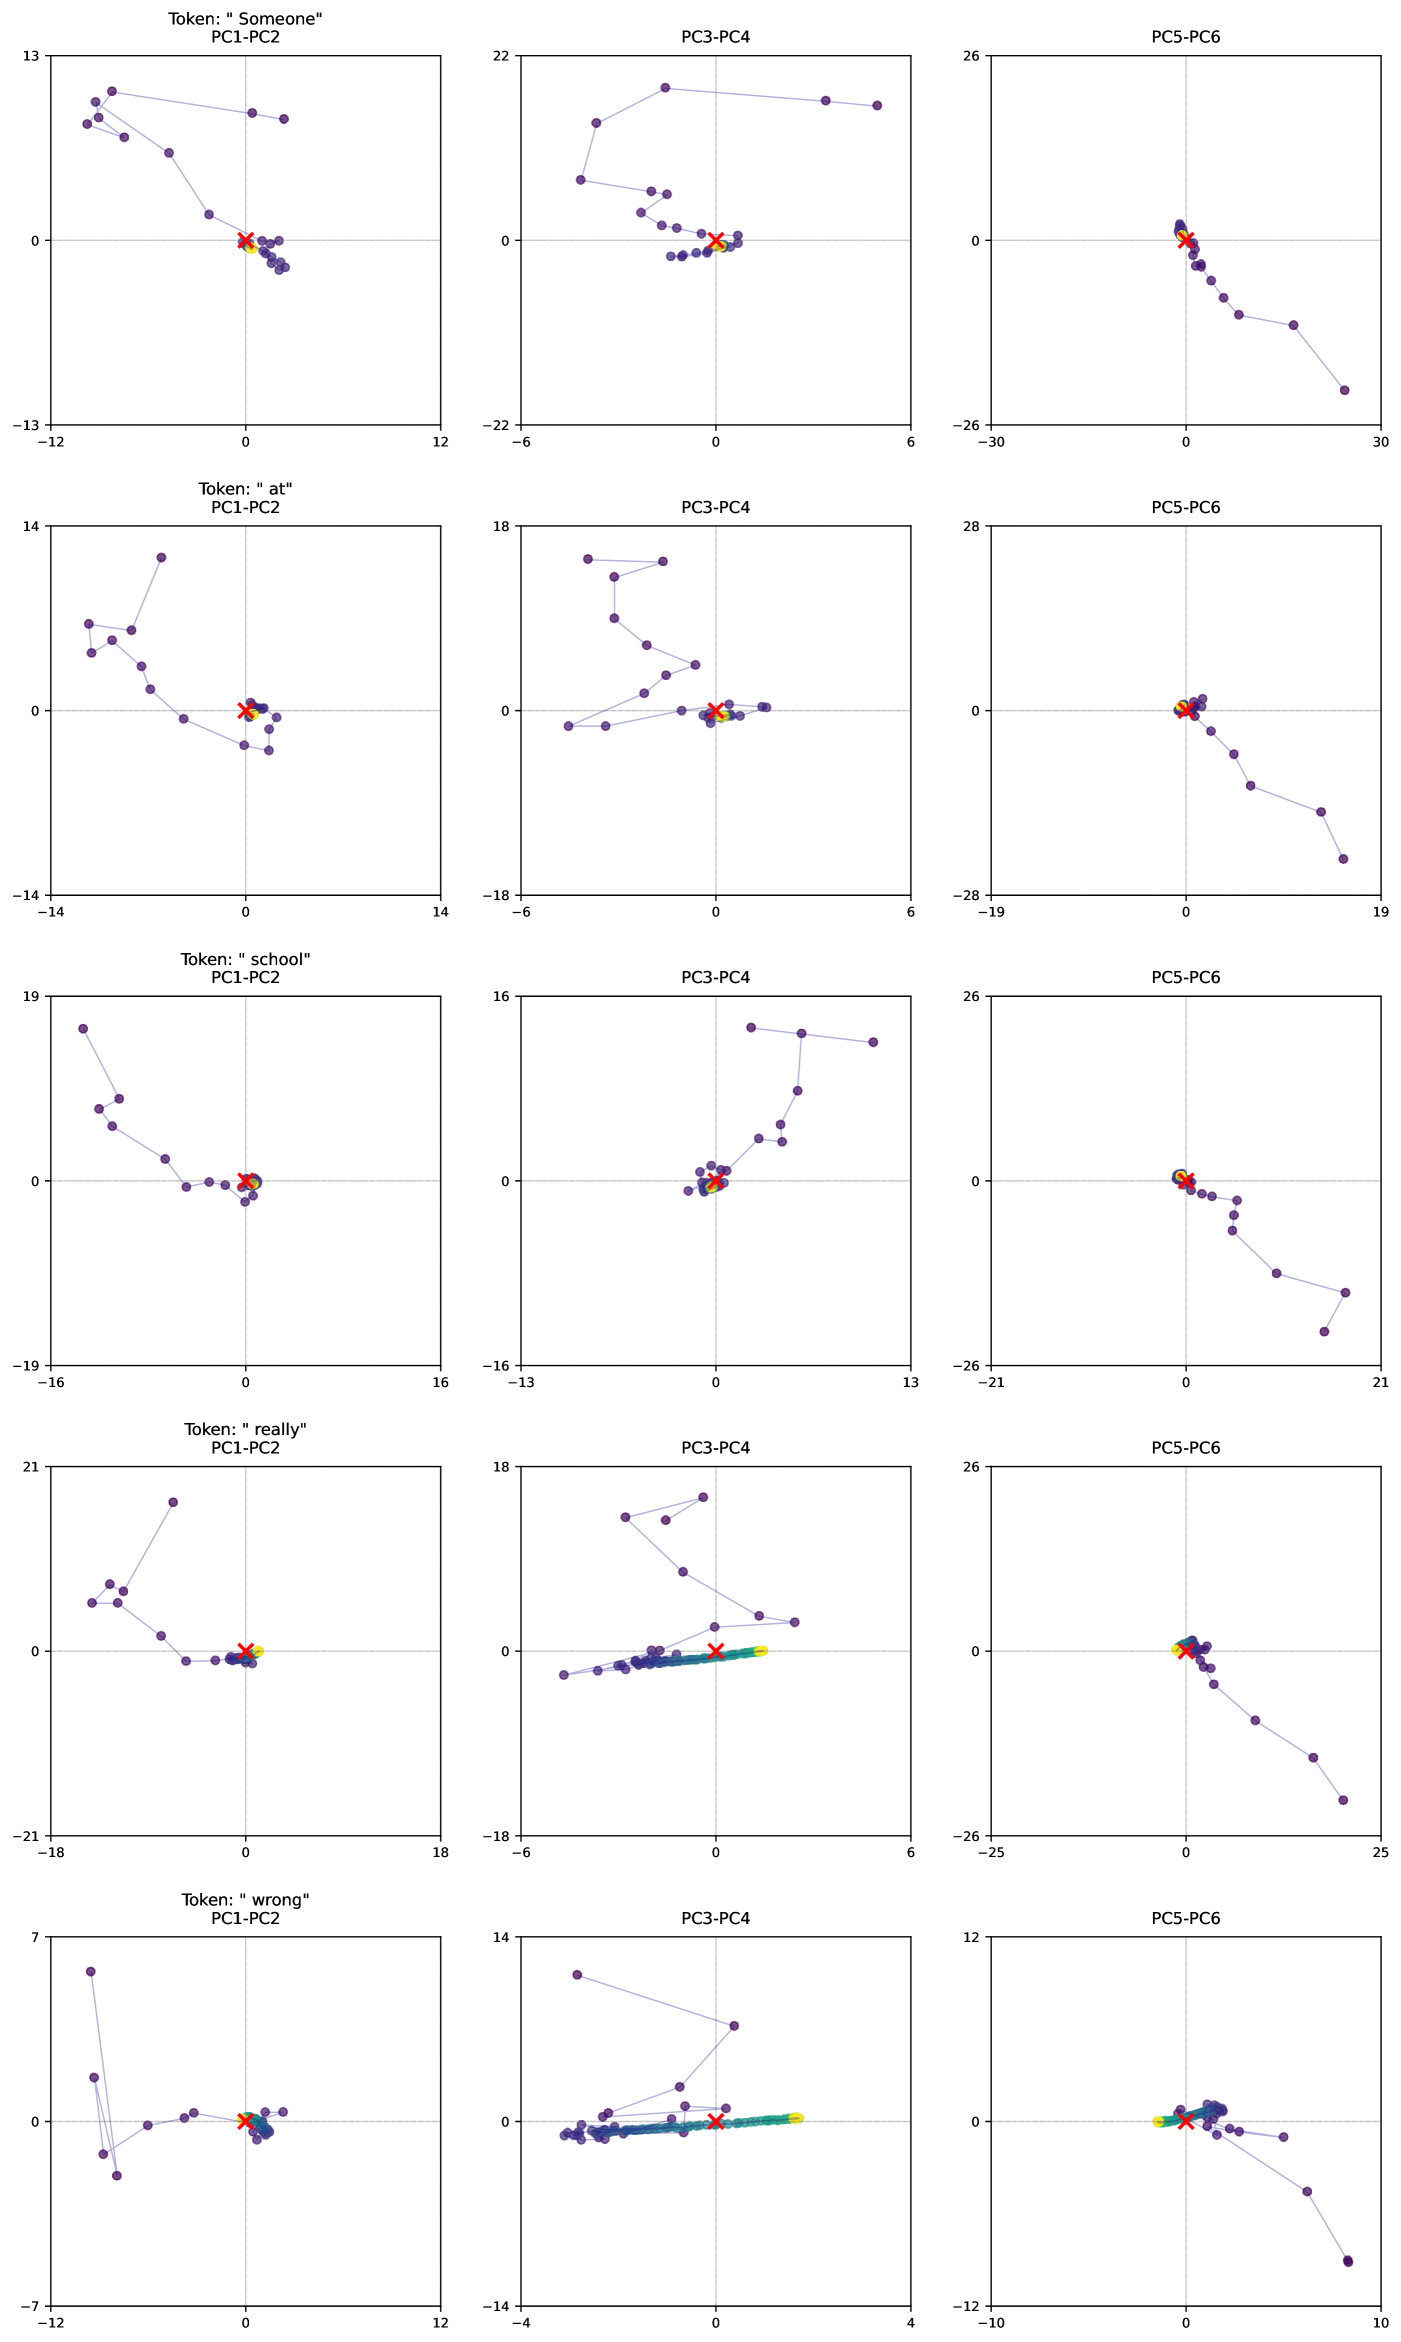
The image presents a series of trajectory plots, arranged in a 5x3 grid. Each row corresponds to a different token ("Someone", "at", "school", "really", "wrong"), and each column represents a different pair of principal components (PC1-PC2, PC3-PC4, PC5-PC6). The plots show the movement of the token's embedding over time in the reduced PCA space. A red 'X' marks the final position of the token.
### Components/Axes
Each subplot has the following characteristics:
* **Title:** "Token: '[token]'\nPC[x]-PC[y]" where [token] is the specific word and [x] and [y] are the principal component numbers.
* **X-axis:** Labeled PC[x], with varying scales depending on the column.
* **Y-axis:** Labeled PC[y], with varying scales depending on the column.
* **Data Points:** Represented by purple circles connected by a light gray line, indicating the trajectory of the token's embedding.
* **Final Position Marker:** A red 'X' marks the final position of the token's embedding.
* **Gridlines:** Light gray dashed lines mark the zero point on both axes.
The specific axis ranges for each column are as follows:
* **PC1-PC2 (Column 1):**
* Token: "Someone": X-axis: -12 to 12, Y-axis: -13 to 13
* Token: "at": X-axis: -14 to 14, Y-axis: -14 to 14
* Token: "school": X-axis: -16 to 16, Y-axis: -19 to 19
* Token: "really": X-axis: -18 to 18, Y-axis: -21 to 21
* Token: "wrong": X-axis: -12 to 12, Y-axis: -7 to 7
* **PC3-PC4 (Column 2):**
* Token: "Someone": X-axis: -6 to 6, Y-axis: -22 to 22
* Token: "at": X-axis: -6 to 6, Y-axis: -18 to 18
* Token: "school": X-axis: -13 to 13, Y-axis: -16 to 16
* Token: "really": X-axis: -6 to 6, Y-axis: -18 to 18
* Token: "wrong": X-axis: -4 to 4, Y-axis: -14 to 14
* **PC5-PC6 (Column 3):**
* Token: "Someone": X-axis: -30 to 30, Y-axis: -26 to 26
* Token: "at": X-axis: -19 to 19, Y-axis: -28 to 28
* Token: "school": X-axis: -21 to 21, Y-axis: -26 to 26
* Token: "really": X-axis: -25 to 25, Y-axis: -26 to 26
* Token: "wrong": X-axis: -10 to 10, Y-axis: -12 to 12
### Detailed Analysis or ### Content Details
**Row 1: Token "Someone"**
* **PC1-PC2:** Starts around (-10, 10), moves towards the center, ending near (0, 0).
* **PC3-PC4:** Starts around (-4, 18), moves towards the center, ending near (0, 0).
* **PC5-PC6:** Starts around (25, -20), moves towards the center, ending near (0, 0).
**Row 2: Token "at"**
* **PC1-PC2:** Starts around (-10, 12), moves towards the center, ending near (0, 0).
* **PC3-PC4:** Starts around (-4, 16), moves towards the center, ending near (0, 0).
* **PC5-PC6:** Starts around (15, -15), moves towards the center, ending near (0, 0).
**Row 3: Token "school"**
* **PC1-PC2:** Starts around (-12, 16), moves towards the center, ending near (0, 0).
* **PC3-PC4:** Starts around (-10, 14), moves towards the center, ending near (0, 0).
* **PC5-PC6:** Starts around (10, -18), moves towards the center, ending near (0, 0).
**Row 4: Token "really"**
* **PC1-PC2:** Starts around (-15, 18), moves towards the center, ending near (0, 0).
* **PC3-PC4:** Starts around (-4, 16), moves towards the center, ending near (0, 0).
* **PC5-PC6:** Starts around (20, -20), moves towards the center, ending near (0, 0).
**Row 5: Token "wrong"**
* **PC1-PC2:** Starts around (-10, 6), moves towards the center, ending near (0, 0).
* **PC3-PC4:** Starts around (-4, 12), moves towards the center, ending near (0, 0).
* **PC5-PC6:** Starts around (8, -10), moves towards the center, ending near (0, 0).
### Key Observations
* All tokens, in all PC pairs, tend to converge towards the center (0,0) of the PCA space.
* The initial positions of the tokens vary significantly across different PC pairs.
* The trajectories are not linear; they often involve changes in direction.
* The PC5-PC6 plots generally show the widest range of initial positions.
### Interpretation
The plots visualize how the embeddings of different tokens change over time within a reduced dimensional space defined by principal components. The convergence towards the center (0,0) suggests that, over time, the token embeddings become more similar to the average embedding in the dataset, or that the later states of the model are more similar to each other. The different initial positions indicate that the tokens start with distinct representations, which are then modified during the training process. The non-linear trajectories suggest that the changes in the embeddings are complex and not simply a linear movement from one point to another. The wider range of initial positions in the PC5-PC6 plots might indicate that these components capture more of the initial variance in the token embeddings. Overall, these plots provide insights into how token representations evolve during the training of a language model.