TECHNICAL ASSET FINGERPRINT
36a9871cf684fa24d7a4ac22
Click to view fullscreen
Press ESC or click to close
FOUND IN PAPERS
EXPERT: gemma-3-27b-it-free VERSION 1
RUNTIME: google-free/gemma-3-27b-it
INTEL_VERIFIED
\n
## Scatter Plot Matrix: Principal Component Analysis Visualizations
### Overview
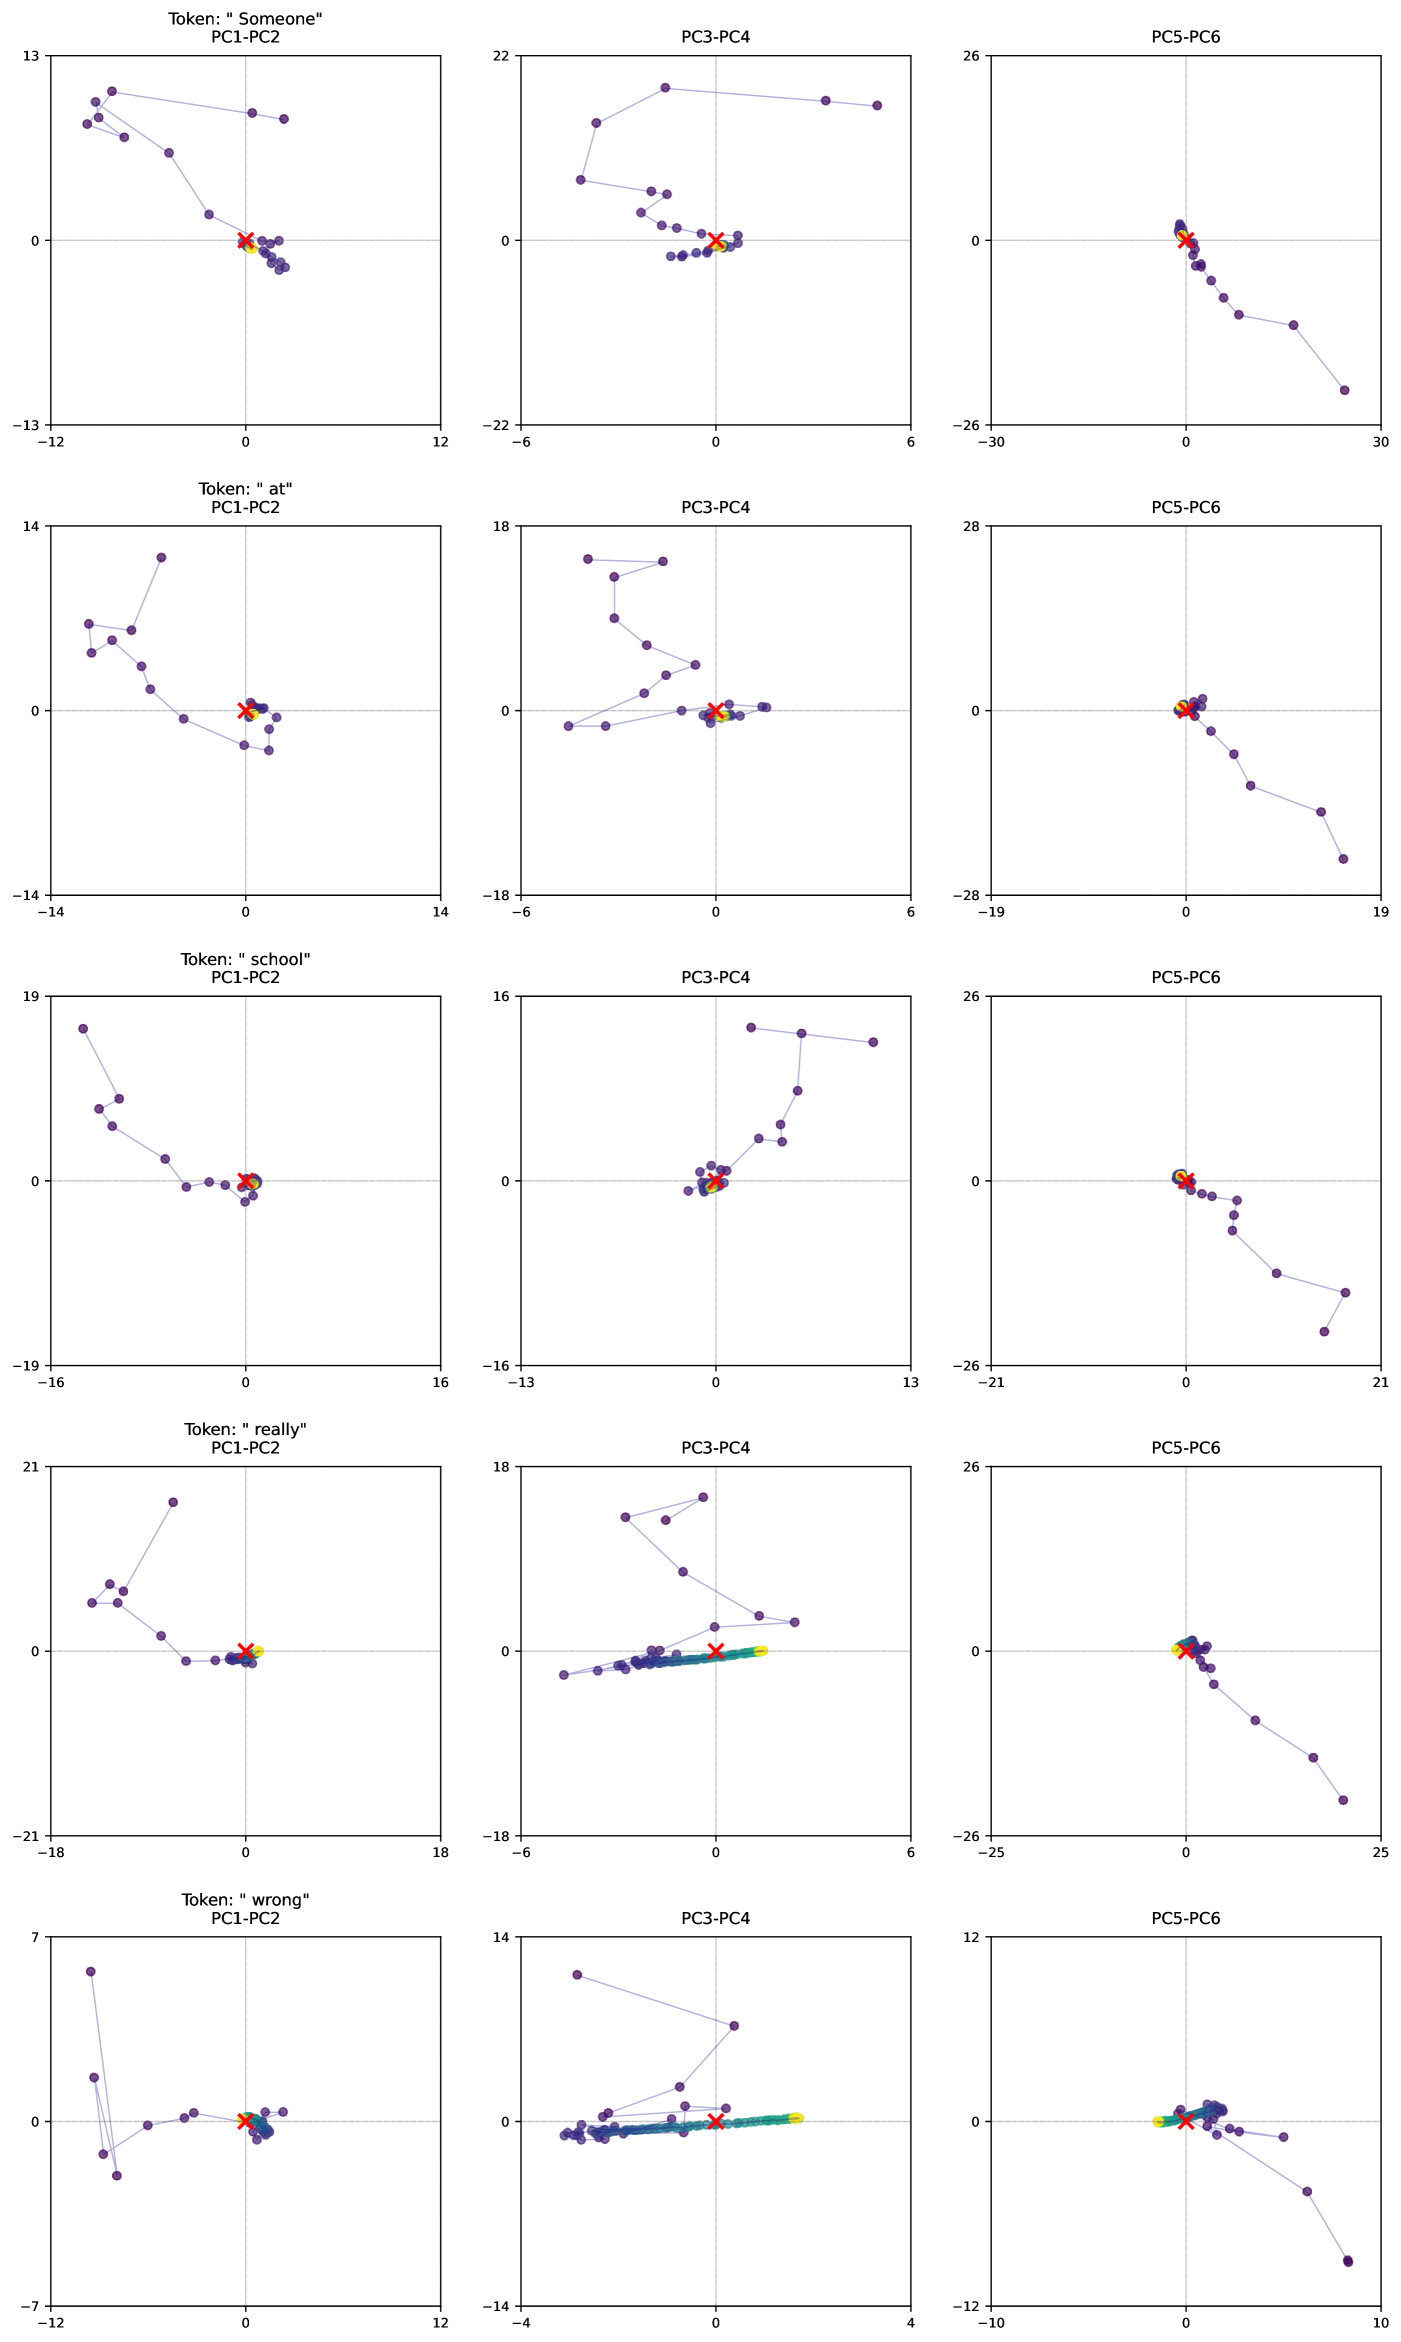
The image presents a 5x3 matrix of scatter plots, each visualizing the relationship between different principal components (PCs). Each row corresponds to a specific "Token" – "Someone", "at", "school", "really", and "wrong". The columns represent different PC pairings: PC1-PC2, PC3-PC4, and PC5-PC6. Each scatter plot displays data points colored according to a specific category, indicated by the legend.
### Components/Axes
* **Rows:** Representing Tokens: "Someone", "at", "school", "really", "wrong".
* **Columns:** Representing Principal Component pairings: PC1-PC2, PC3-PC4, PC5-PC6.
* **X-axis:** Values range approximately from -22 to 30 (PC1-PC2), -14 to 12 (PC3-PC4), and -12 to 10 (PC5-PC6), depending on the plot.
* **Y-axis:** Values range approximately from -14 to 13 (PC1-PC2), -18 to 18 (PC3-PC4), and -28 to 26 (PC5-PC6), depending on the plot.
* **Legend:** Contains five distinct colors, each corresponding to a category. The colors are:
* Purple
* Green
* Blue
* Red
* Teal
### Detailed Analysis or Content Details
**Row 1: Token: "Someone"**
* **PC1-PC2:** Data points are primarily clustered in the bottom-left quadrant. The purple data points form a curved line sloping upwards from left to right. The green points are scattered. The blue points are clustered near the origin. The red points are scattered. The teal points are scattered.
* **PC3-PC4:** Data points are scattered. The purple data points form a line sloping downwards from left to right. The green points are scattered. The blue points are clustered near the origin. The red points are scattered. The teal points are scattered.
* **PC5-PC6:** Data points are scattered. The purple data points form a line sloping upwards from left to right. The green points are scattered. The blue points are clustered near the origin. The red points are scattered. The teal points are scattered.
**Row 2: Token: "at"**
* **PC1-PC2:** Data points are clustered in the bottom-right quadrant. The purple data points form a curved line sloping downwards from left to right. The green points are scattered. The blue points are clustered near the origin. The red points are scattered. The teal points are scattered.
* **PC3-PC4:** Data points are scattered. The purple data points form a line sloping downwards from left to right. The green points are scattered. The blue points are clustered near the origin. The red points are scattered. The teal points are scattered.
* **PC5-PC6:** Data points are scattered. The purple data points form a line sloping upwards from left to right. The green points are scattered. The blue points are clustered near the origin. The red points are scattered. The teal points are scattered.
**Row 3: Token: "school"**
* **PC1-PC2:** Data points are clustered in the bottom-left quadrant. The purple data points form a curved line sloping upwards from left to right. The green points are scattered. The blue points are clustered near the origin. The red points are scattered. The teal points are scattered.
* **PC3-PC4:** Data points are scattered. The purple data points form a line sloping downwards from left to right. The green points are scattered. The blue points are clustered near the origin. The red points are scattered. The teal points are scattered.
* **PC5-PC6:** Data points are scattered. The purple data points form a line sloping upwards from left to right. The green points are scattered. The blue points are clustered near the origin. The red points are scattered. The teal points are scattered.
**Row 4: Token: "really"**
* **PC1-PC2:** Data points are clustered in the bottom-left quadrant. The purple data points form a curved line sloping upwards from left to right. The green points are scattered. The blue points are clustered near the origin. The red points are scattered. The teal points are scattered.
* **PC3-PC4:** Data points are scattered. The purple data points form a line sloping downwards from left to right. The green points are scattered. The blue points are clustered near the origin. The red points are scattered. The teal points are scattered.
* **PC5-PC6:** Data points are scattered. The purple data points form a line sloping upwards from left to right. The green points are scattered. The blue points are clustered near the origin. The red points are scattered. The teal points are scattered.
**Row 5: Token: "wrong"**
* **PC1-PC2:** Data points are clustered in the bottom-left quadrant. The purple data points form a curved line sloping upwards from left to right. The green points are scattered. The blue points are clustered near the origin. The red points are scattered. The teal points are scattered.
* **PC3-PC4:** Data points are scattered. The purple data points form a line sloping downwards from left to right. The green points are scattered. The blue points are clustered near the origin. The red points are scattered. The teal points are scattered.
* **PC5-PC6:** Data points are scattered. The purple data points form a line sloping upwards from left to right. The green points are scattered. The blue points are clustered near the origin. The red points are scattered. The teal points are scattered.
### Key Observations
* The purple data points consistently exhibit a linear or curved trend in each plot, suggesting a strong correlation between the corresponding principal components for that token.
* The blue data points are often clustered near the origin, indicating low variance along those principal components.
* The green, red, and teal data points are generally more scattered, suggesting less distinct patterns.
* The patterns observed for each token are relatively consistent across the different PC pairings.
### Interpretation
This visualization represents the results of a Principal Component Analysis (PCA) performed on a dataset associated with the tokens "Someone", "at", "school", "really", and "wrong". PCA is a dimensionality reduction technique used to identify the most important underlying patterns in data.
Each scatter plot shows how the data points are distributed across two principal components. The principal components are orthogonal (uncorrelated) axes that capture the maximum variance in the data.
The consistent trends observed in the purple data points suggest that these categories are strongly associated with the corresponding principal components. The clustering of blue points near the origin indicates that these categories have low variance along those components. The scattered nature of the green, red, and teal points suggests that these categories are less well-defined or have more complex relationships with the principal components.
The matrix format allows for a comprehensive comparison of the relationships between different principal components for each token. This can provide insights into the underlying structure of the data and help to identify important features or patterns. The consistent patterns across tokens suggest that the PCA is capturing meaningful information about the data.
DECODING INTELLIGENCE...