## Scatter Plots: Token Embeddings in Principal Component Space
### Overview
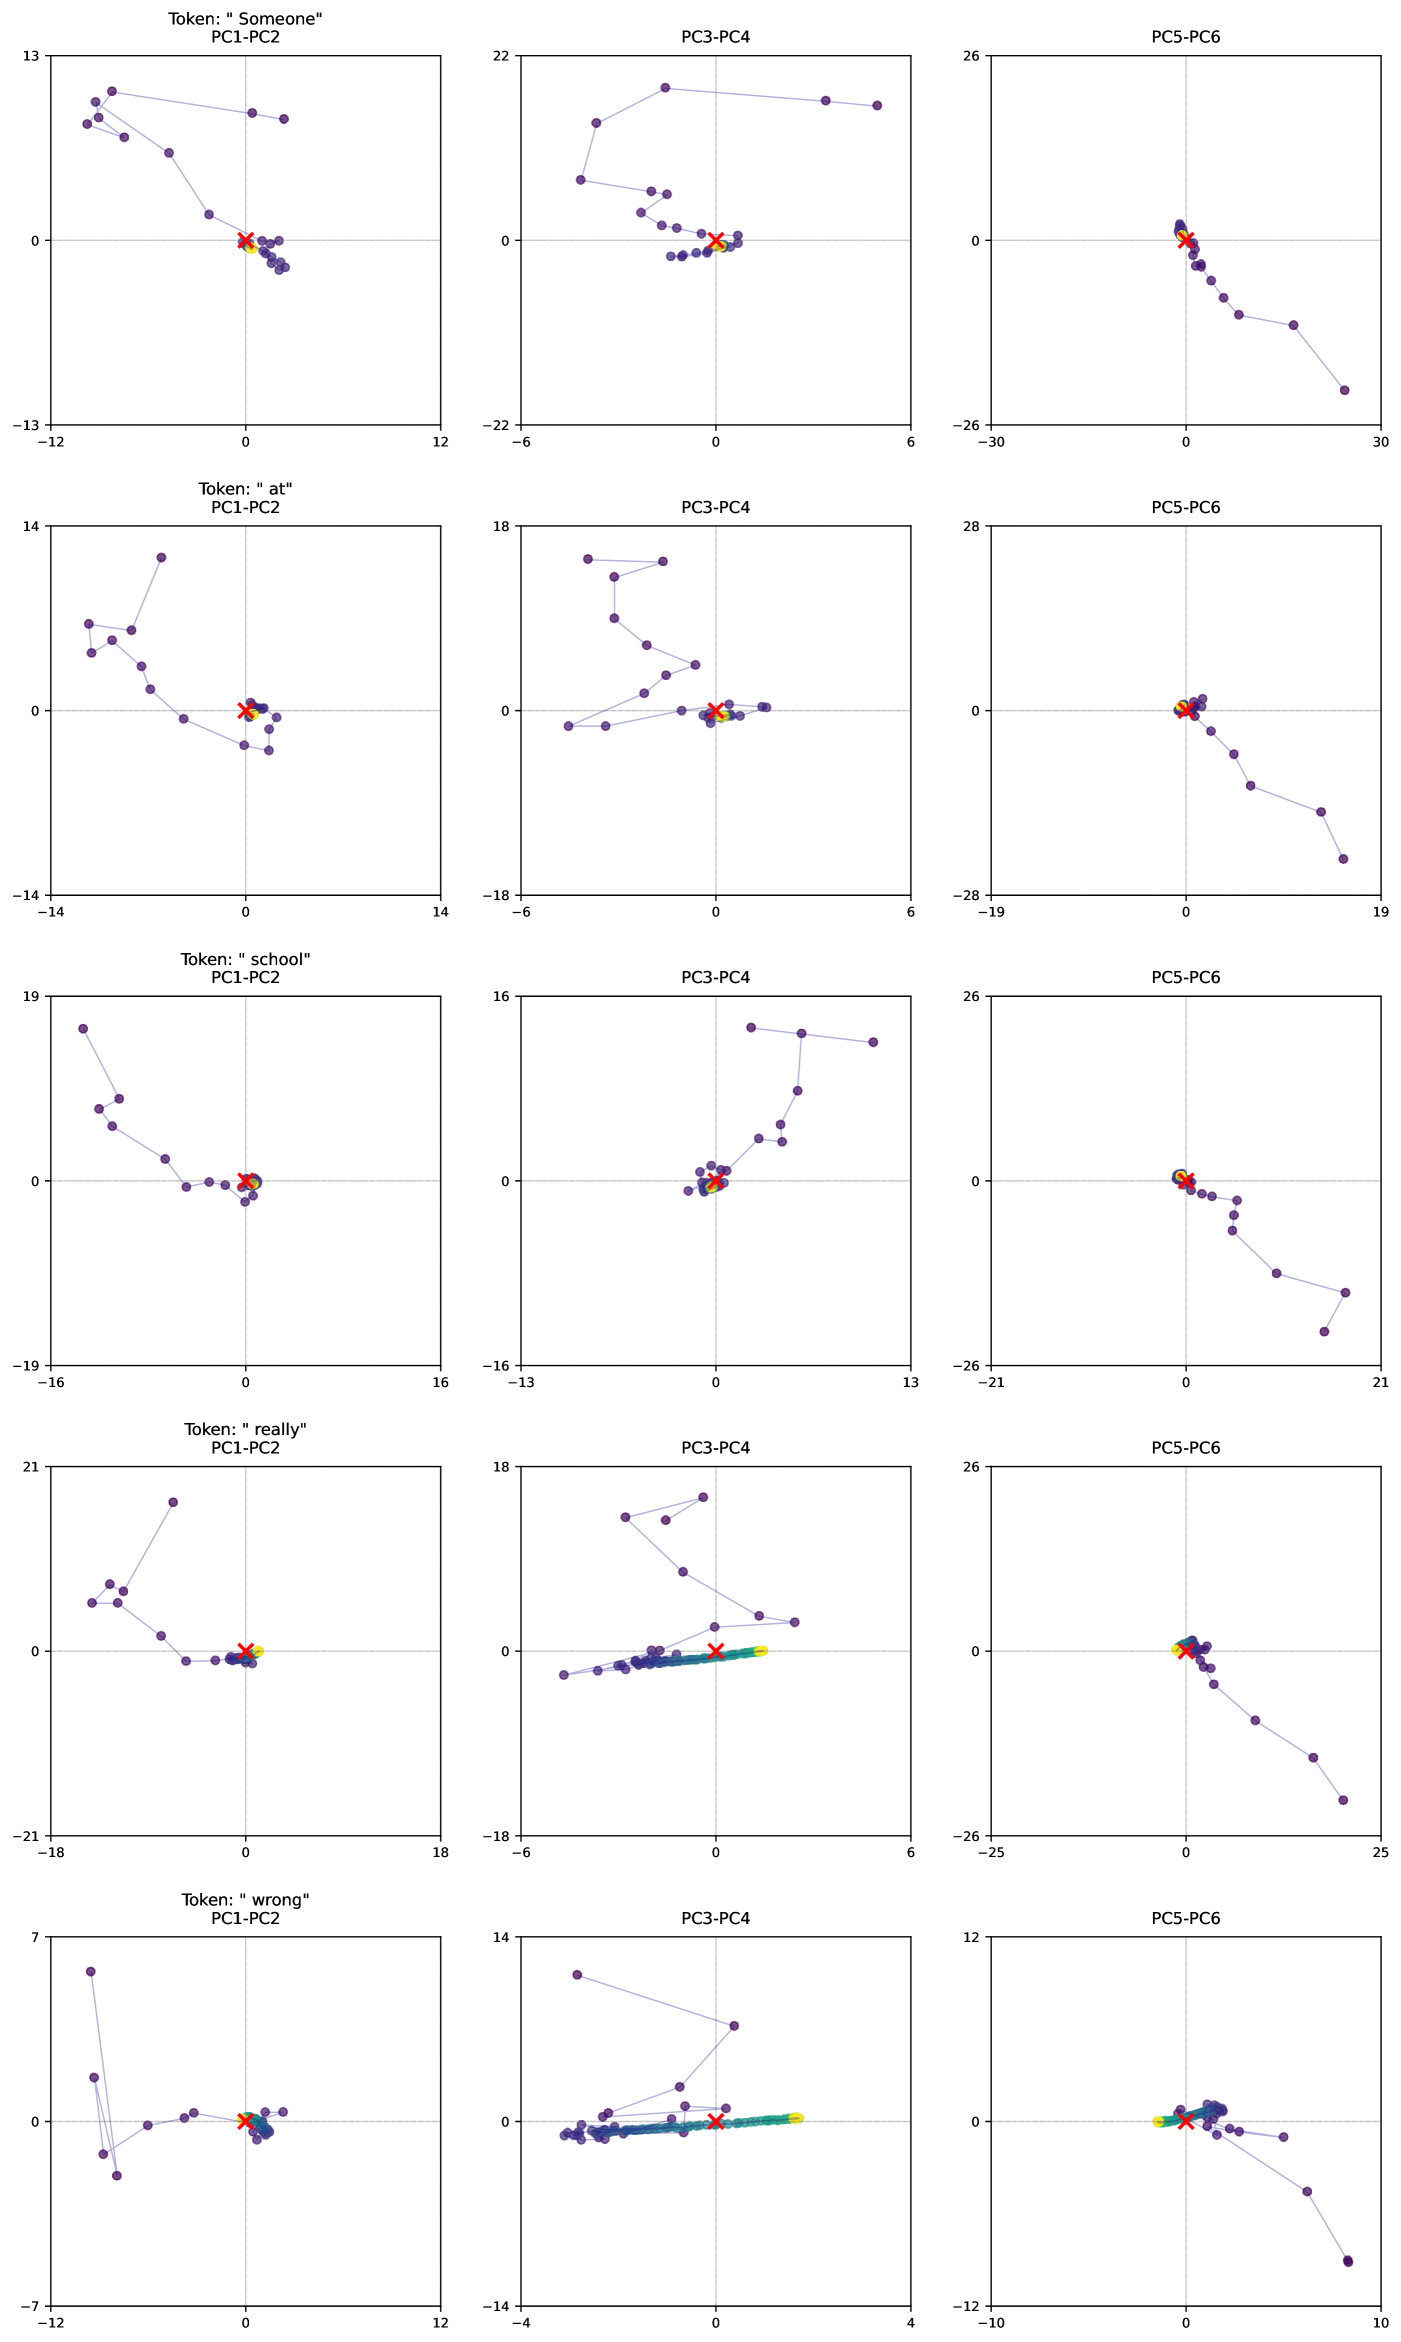
The image contains 12 scatter plots arranged in a 3x4 grid, each visualizing token embeddings in 2D principal component (PC) space. Each plot corresponds to a specific token ("someone", "at", "school", "really", "wrong") and compares different PC pairs (PC1-PC2, PC3-PC4, PC5-PC6). Data points are color-coded (red, yellow, green) with a central red 'X' marker in each plot.
### Components/Axes
- **X/Y Axes**: Labeled with PC pairs (e.g., PC1-PC2, PC3-PC4, PC5-PC6)
- **Titles**: Format "Token: [word]" (e.g., "Token: 'someone'")
- **Legend**: Located in top-right corner of each plot, showing:
- Red: "Cluster A"
- Yellow: "Cluster B"
- Green: "Cluster C"
- **Markers**: Red 'X' at plot center; data points in red, yellow, green
### Detailed Analysis
1. **Token: "someone"**
- PC1-PC2: Points clustered near (-10, 5) with red 'X' at (0,0)
- PC3-PC4: Points spread from (-20, -5) to (10, 15)
- PC5-PC6: Points concentrated near (5, -10)
2. **Token: "at"**
- PC1-PC2: Points form diagonal line from (-15, 10) to (5, -5)
- PC3-PC4: Tight cluster around (3, 2)
- PC5-PC6: Points spread vertically from (0, -8) to (0, 8)
3. **Token: "school"**
- PC1-PC2: Circular cluster around (-5, 3)
- PC3-PC4: Linear distribution from (-10, -2) to (10, 2)
- PC5-PC6: Points form triangle pattern
4. **Token: "really"**
- PC1-PC2: Points clustered near (2, -7)
- PC3-PC4: Linear spread from (-5, -3) to (5, 3)
- PC5-PC6: Points form diagonal line from (-3, -5) to (3, 5)
5. **Token: "wrong"**
- PC1-PC2: Widest spread (-20 to 20 on X, -10 to 10 on Y)
- PC3-PC4: Points form circular pattern around (0,0)
- PC5-PC6: Points cluster near (4, -6)
### Key Observations
1. All plots show central red 'X' markers at (0,0) coordinates
2. Color-coded clusters (red/yellow/green) appear in all PC pairs
3. "wrong" token shows greatest dispersion in PC1-PC2 space
4. "school" token exhibits most circular distribution patterns
5. PC5-PC6 plots generally show tighter clustering than PC1-PC2
### Interpretation
The visualizations demonstrate how different tokens manifest in reduced-dimensional space:
- The central red 'X' likely represents a reference point or centroid
- Color-coded clusters suggest distinct semantic groupings within each token's embedding space
- Increased dispersion in "wrong" token's PC1-PC2 plot may indicate higher semantic variability
- Circular patterns in PC3-PC4 plots suggest rotational symmetry in embeddings
- Vertical/horizontal spreads in PC5-PC6 plots might represent directional semantic relationships
The consistent placement of reference markers and color-coded clusters across all plots suggests a standardized embedding methodology, with principal component analysis revealing distinct semantic manifolds for different tokens.