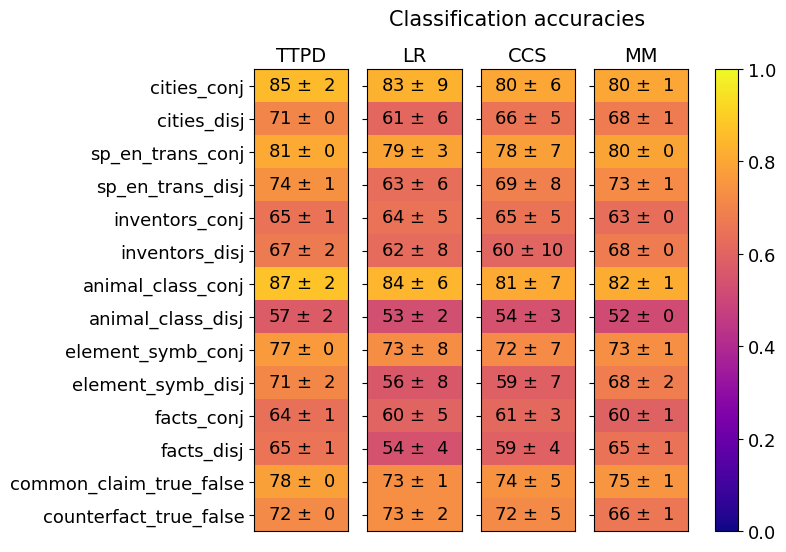
## Heatmap: Classification Accuracies
### Overview
The image is a heatmap displaying classification accuracies for different models (TTPD, LR, CCS, MM) across various categories (cities_conj, cities_disj, etc.). The color intensity represents the accuracy score, ranging from dark blue (0.0) to bright yellow (1.0), as indicated by the colorbar on the right. Each cell contains the accuracy score ± its standard deviation.
### Components/Axes
* **Title:** Classification accuracies
* **Columns (Models):** TTPD, LR, CCS, MM
* **Rows (Categories):** cities\_conj, cities\_disj, sp\_en\_trans\_conj, sp\_en\_trans\_disj, inventors\_conj, inventors\_disj, animal\_class\_conj, animal\_class\_disj, element\_symb\_conj, element\_symb\_disj, facts\_conj, facts\_disj, common\_claim\_true\_false, counterfact\_true\_false
* **Colorbar:** Ranges from 0.0 (dark blue) to 1.0 (bright yellow), representing the classification accuracy.
### Detailed Analysis
Here's a breakdown of the accuracy scores for each category and model:
* **cities\_conj:**
* TTPD: 85 ± 2
* LR: 83 ± 9
* CCS: 80 ± 6
* MM: 80 ± 1
* **cities\_disj:**
* TTPD: 71 ± 0
* LR: 61 ± 6
* CCS: 66 ± 5
* MM: 68 ± 1
* **sp\_en\_trans\_conj:**
* TTPD: 81 ± 0
* LR: 79 ± 3
* CCS: 78 ± 7
* MM: 80 ± 0
* **sp\_en\_trans\_disj:**
* TTPD: 74 ± 1
* LR: 63 ± 6
* CCS: 69 ± 8
* MM: 73 ± 1
* **inventors\_conj:**
* TTPD: 65 ± 1
* LR: 64 ± 5
* CCS: 65 ± 5
* MM: 63 ± 0
* **inventors\_disj:**
* TTPD: 67 ± 2
* LR: 62 ± 8
* CCS: 60 ± 10
* MM: 68 ± 0
* **animal\_class\_conj:**
* TTPD: 87 ± 2
* LR: 84 ± 6
* CCS: 81 ± 7
* MM: 82 ± 1
* **animal\_class\_disj:**
* TTPD: 57 ± 2
* LR: 53 ± 2
* CCS: 54 ± 3
* MM: 52 ± 0
* **element\_symb\_conj:**
* TTPD: 77 ± 0
* LR: 73 ± 8
* CCS: 72 ± 7
* MM: 73 ± 1
* **element\_symb\_disj:**
* TTPD: 71 ± 2
* LR: 56 ± 8
* CCS: 59 ± 7
* MM: 68 ± 2
* **facts\_conj:**
* TTPD: 64 ± 1
* LR: 60 ± 5
* CCS: 61 ± 3
* MM: 60 ± 1
* **facts\_disj:**
* TTPD: 65 ± 1
* LR: 54 ± 4
* CCS: 59 ± 4
* MM: 65 ± 1
* **common\_claim\_true\_false:**
* TTPD: 78 ± 0
* LR: 73 ± 1
* CCS: 74 ± 5
* MM: 75 ± 1
* **counterfact\_true\_false:**
* TTPD: 72 ± 0
* LR: 73 ± 2
* CCS: 72 ± 5
* MM: 66 ± 1
### Key Observations
* TTPD generally shows higher accuracy scores compared to other models, especially for categories like "animal\_class\_conj".
* The "animal\_class\_disj" category consistently has the lowest accuracy scores across all models.
* The standard deviations vary across models and categories, indicating different levels of consistency in performance. LR and CCS models often have higher standard deviations.
### Interpretation
The heatmap provides a visual comparison of the classification accuracies of four different models across a range of categories. The color-coding allows for quick identification of the best-performing models for each category. The data suggests that the TTPD model generally outperforms the others, but its advantage is not uniform across all categories. The lower accuracy scores for "animal\_class\_disj" suggest that this category poses a greater challenge for all models. The standard deviations indicate the reliability of the accuracy scores, with higher deviations suggesting more variability in the model's performance. The data could be used to select the best model for a specific category or to identify areas where model performance needs improvement.