## Heatmap: Classification Accuracies
### Overview
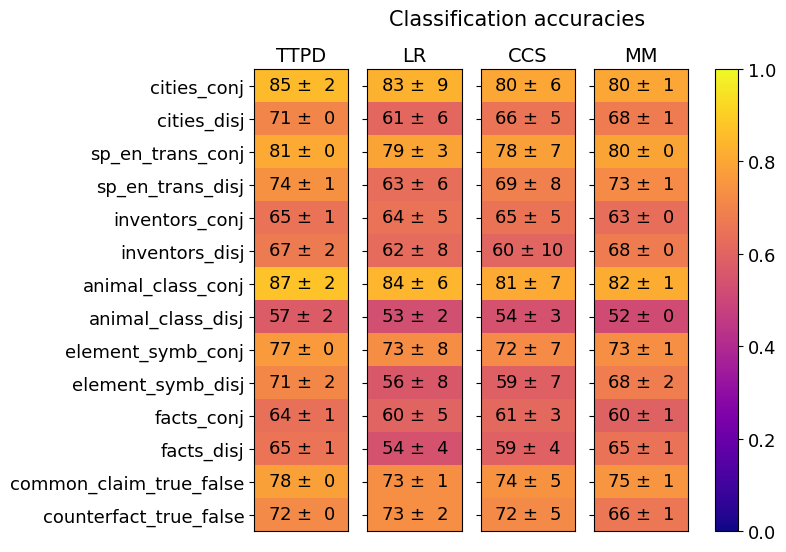
This image presents a heatmap displaying classification accuracies for various datasets and methods. The heatmap visualizes the performance of four different classification methods (TTPD, LR, CCS, MM) across ten different datasets, each presented in two variations: 'conj' (conjunctive) and 'disj' (disjunctive). The color intensity represents the accuracy score, with a scale ranging from 0.0 to 1.0.
### Components/Axes
* **Y-axis (Rows):** Represents the datasets. The datasets are:
* cities\_conj
* cities\_disj
* sp\_en\_trans\_conj
* sp\_en\_trans\_disj
* inventors\_conj
* inventors\_disj
* animal\_class\_conj
* animal\_class\_disj
* element\_symb\_conj
* element\_symb\_disj
* facts\_conj
* facts\_disj
* common\_claim\_true\_false
* counterfact\_true\_false
* **X-axis (Columns):** Represents the classification methods:
* TTPD
* LR
* CCS
* MM
* **Color Scale (Right):** Represents the classification accuracy, ranging from 0.0 (red) to 1.0 (green).
* **Title:** "Classification accuracies" (positioned at the top-center)
### Detailed Analysis
The heatmap displays accuracy values with standard deviation. The values are presented as "mean ± standard deviation". I will analyze each row and column, noting trends and specific values.
* **cities\_conj:** TTPD: 85 ± 2, LR: 83 ± 9, CCS: 80 ± 6, MM: 80 ± 1
* **cities\_disj:** TTPD: 71 ± 0, LR: 61 ± 6, CCS: 66 ± 5, MM: 68 ± 1
* **sp\_en\_trans\_conj:** TTPD: 81 ± 0, LR: 79 ± 3, CCS: 78 ± 7, MM: 80 ± 0
* **sp\_en\_trans\_disj:** TTPD: 74 ± 1, LR: 63 ± 6, CCS: 69 ± 8, MM: 73 ± 1
* **inventors\_conj:** TTPD: 65 ± 1, LR: 64 ± 5, CCS: 65 ± 5, MM: 63 ± 0
* **inventors\_disj:** TTPD: 67 ± 2, LR: 62 ± 8, CCS: 60 ± 10, MM: 68 ± 0
* **animal\_class\_conj:** TTPD: 87 ± 2, LR: 84 ± 6, CCS: 81 ± 7, MM: 82 ± 1
* **animal\_class\_disj:** TTPD: 57 ± 2, LR: 53 ± 2, CCS: 54 ± 3, MM: 52 ± 0
* **element\_symb\_conj:** TTPD: 73 ± 8, LR: 73 ± 8, CCS: 72 ± 7, MM: 73 ± 1
* **element\_symb\_disj:** TTPD: 71 ± 2, LR: 56 ± 8, CCS: 59 ± 7, MM: 68 ± 2
* **facts\_conj:** TTPD: 64 ± 1, LR: 60 ± 5, CCS: 61 ± 3, MM: 60 ± 1
* **facts\_disj:** TTPD: 65 ± 1, LR: 54 ± 4, CCS: 59 ± 4, MM: 65 ± 1
* **common\_claim\_true\_false:** TTPD: 78 ± 0, LR: 73 ± 1, CCS: 74 ± 5, MM: 75 ± 1
* **counterfact\_true\_false:** TTPD: 72 ± 0, LR: 73 ± 2, CCS: 72 ± 5, MM: 66 ± 1
**Trends:**
* **TTPD** generally performs well, often achieving the highest accuracies, particularly on the 'conj' variations of the datasets.
* **LR** shows more variability in performance, with lower accuracies on the 'disj' variations.
* **CCS** consistently falls in the middle range of performance.
* **MM** shows good performance, often comparable to TTPD, but with some variations.
* The 'conj' variations generally have higher accuracies than the 'disj' variations across all methods.
### Key Observations
* The highest accuracy achieved is 87 ± 2 (TTPD on animal\_class\_conj).
* The lowest accuracy achieved is 52 ± 0 (MM on animal\_class\_disj).
* The standard deviations are generally small, indicating consistent performance.
* TTPD consistently outperforms other methods on the 'conj' datasets.
* The performance gap between 'conj' and 'disj' datasets is noticeable across all methods.
### Interpretation
The heatmap demonstrates the performance of different classification methods on a variety of datasets, distinguished by whether they are presented in a conjunctive or disjunctive format. The consistently high performance of TTPD suggests it is a robust method for these types of classification tasks, particularly when dealing with conjunctive data. The lower accuracies observed on the 'disj' datasets indicate that these methods may struggle with more complex or nuanced data representations. The small standard deviations suggest that the results are reliable and not heavily influenced by random variation. The differences in performance between the methods highlight the importance of selecting an appropriate classification algorithm based on the specific characteristics of the dataset. The heatmap provides a clear visual comparison of the strengths and weaknesses of each method, enabling informed decision-making in the context of classification tasks. The data suggests that the conjunctive form of the datasets is easier to classify than the disjunctive form, potentially due to the simpler logical structure of conjunctive statements.