## Heatmap: Classification Accuracies
### Overview
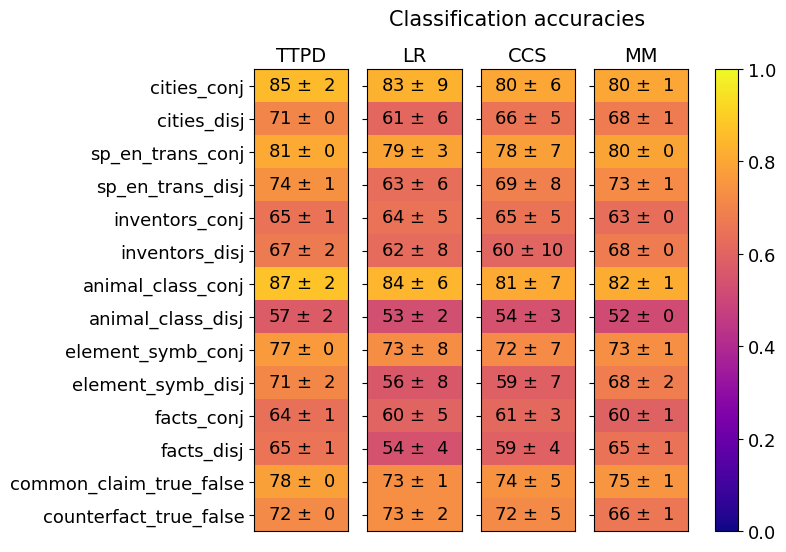
The image is a heatmap visualizing classification accuracies across four models (TTPD, LR, CCS, MM) for 12 linguistic/categorical tasks. Values are represented as mean accuracies (± standard deviation) with a color gradient from purple (0.0) to yellow (1.0).
### Components/Axes
- **X-axis (Models)**: TTPD, LR, CCS, MM (left to right)
- **Y-axis (Categories)**:
1. cities_conj
2. cities_disj
3. sp_en_trans_conj
4. sp_en_trans_disj
5. inventors_conj
6. inventors_disj
7. animal_class_conj
8. animal_class_disj
9. element_symb_conj
10. element_symb_disj
11. facts_conj
12. facts_disj
13. common_claim_true_false
14. counterfact_true_false
- **Legend**: Vertical colorbar on the right (purple = 0.0, yellow = 1.0)
### Detailed Analysis
- **cities_conj**:
- TTPD: 85 ± 2 (yellow)
- LR: 83 ± 9 (orange)
- CCS: 80 ± 6 (orange)
- MM: 80 ± 1 (orange)
- **cities_disj**:
- TTPD: 71 ± 0 (orange)
- LR: 61 ± 6 (red)
- CCS: 66 ± 5 (red)
- MM: 68 ± 1 (red)
- **sp_en_trans_conj**:
- TTPD: 81 ± 0 (orange)
- LR: 79 ± 3 (orange)
- CCS: 78 ± 7 (orange)
- MM: 80 ± 0 (orange)
- **sp_en_trans_disj**:
- TTPD: 74 ± 1 (orange)
- LR: 63 ± 6 (red)
- CCS: 69 ± 8 (red)
- MM: 73 ± 1 (orange)
- **inventors_conj**:
- TTPD: 65 ± 1 (red)
- LR: 64 ± 5 (red)
- CCS: 65 ± 5 (red)
- MM: 63 ± 0 (red)
- **inventors_disj**:
- TTPD: 67 ± 2 (red)
- LR: 62 ± 8 (red)
- CCS: 60 ± 10 (red)
- MM: 68 ± 0 (red)
- **animal_class_conj**:
- TTPD: 87 ± 2 (yellow)
- LR: 84 ± 6 (orange)
- CCS: 81 ± 7 (orange)
- MM: 82 ± 1 (orange)
- **animal_class_disj**:
- TTPD: 57 ± 2 (red)
- LR: 53 ± 2 (red)
- CCS: 54 ± 3 (red)
- MM: 52 ± 0 (red)
- **element_symb_conj**:
- TTPD: 77 ± 0 (orange)
- LR: 73 ± 8 (red)
- CCS: 72 ± 7 (red)
- MM: 73 ± 1 (orange)
- **element_symb_disj**:
- TTPD: 71 ± 2 (orange)
- LR: 56 ± 8 (red)
- CCS: 59 ± 7 (red)
- MM: 68 ± 2 (orange)
- **facts_conj**:
- TTPD: 64 ± 1 (red)
- LR: 60 ± 5 (red)
- CCS: 61 ± 3 (red)
- MM: 60 ± 1 (red)
- **facts_disj**:
- TTPD: 65 ± 1 (red)
- LR: 54 ± 4 (red)
- CCS: 59 ± 4 (red)
- MM: 65 ± 1 (orange)
- **common_claim_true_false**:
- TTPD: 78 ± 0 (orange)
- LR: 73 ± 1 (orange)
- CCS: 74 ± 5 (orange)
- MM: 75 ± 1 (orange)
- **counterfact_true_false**:
- TTPD: 72 ± 0 (orange)
- LR: 73 ± 2 (orange)
- CCS: 72 ± 5 (orange)
- MM: 66 ± 1 (orange)
### Key Observations
1. **Model Performance**:
- TTPD and LR consistently outperform CCS and MM in conjunction tasks (e.g., cities_conj, animal_class_conj).
- Disjunction tasks (e.g., cities_disj, sp_en_trans_disj) show lower accuracies across all models.
2. **Standard Deviation**:
- CCS exhibits higher variability (e.g., inventors_disj: ±10), while TTPD often has lower variability (e.g., cities_disj: ±0).
3. **Outliers**:
- inventors_disj (CCS: 60 ± 10) and animal_class_disj (MM: 52 ± 0) represent the lowest accuracies.
- animal_class_conj (TTPD: 87 ± 2) and cities_conj (TTPD: 85 ± 2) are the highest-performing tasks.
### Interpretation
The data suggests that **TTPD and LR models excel in conjunction-based tasks** (e.g., cities_conj, animal_class_conj), achieving near-optimal accuracies (80-87%). Disjunction tasks (e.g., cities_disj, sp_en_trans_disj) are more challenging, with accuracies dropping to 50-70%. The **CCS model shows the greatest inconsistency**, particularly in inventors_disj (±10), while TTPD demonstrates the most stable performance (e.g., cities_disj: ±0). The **MM model performs comparably to TTPD/LR in conjunction tasks** but lags in disjunction tasks. This pattern implies that conjunction tasks may rely on simpler linguistic features, while disjunction tasks require more complex reasoning, which current models struggle to handle reliably.