TECHNICAL ASSET FINGERPRINT
36ad04a5b6e0bea17f661eae
Click to view fullscreen
Press ESC or click to close
FOUND IN PAPERS
EXPERT: healer-alpha-free VERSION 1
RUNTIME: free/openrouter/healer-alpha
INTEL_VERIFIED
## Multi-Panel Technical Performance Analysis
### Overview
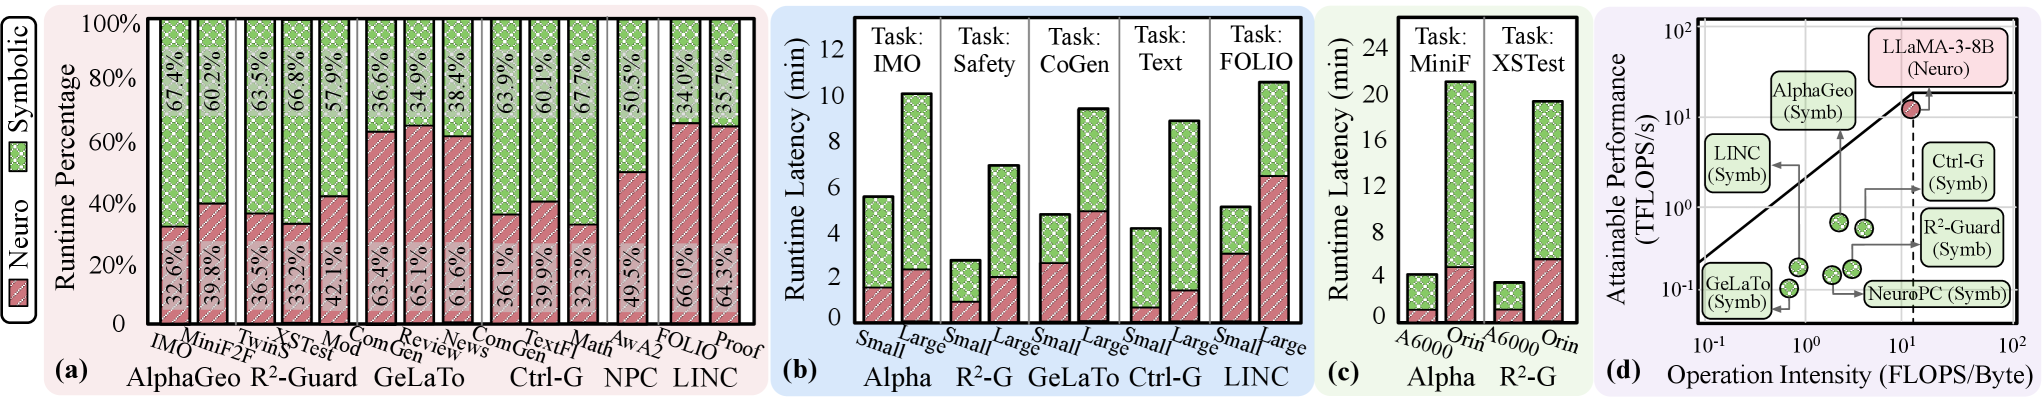
The image contains four distinct subplots (labeled a, b, c, d) presenting performance metrics for various AI systems, primarily comparing "Neuro" (neural) and "Symbolic" approaches across different tasks and hardware. The charts analyze runtime composition, latency, and computational efficiency.
### Components/Axes
The image is divided into four panels:
* **Panel (a):** A stacked bar chart titled "Runtime Percentage". The Y-axis is labeled "Runtime Percentage" from 0% to 100%. The X-axis lists 14 different systems or tasks. A legend on the left defines two categories: "Neuro" (red, diagonal hatch pattern) and "Symbolic" (green, cross-hatch pattern).
* **Panel (b):** A grouped bar chart titled "Runtime Latency (min)". The Y-axis is labeled "Runtime Latency (min)" from 0 to 12. The X-axis groups data by five systems (Alpha, R²-G, GeLaTo, Ctrl-G, LINC), each with two bars labeled "Small" and "Large". A legend within the chart area defines "Neuro" (red) and "Symbolic" (green).
* **Panel (c):** A grouped bar chart titled "Runtime Latency (min)". The Y-axis is labeled "Runtime Latency (min)" from 0 to 24. The X-axis groups data by two systems (Alpha, R²-G), each with two bars labeled "A6000" and "Orin". A legend within the chart area defines "Neuro" (red) and "Symbolic" (green).
* **Panel (d):** A scatter plot on a log-log scale. The Y-axis is labeled "Attainable Performance (TFLOPS/s)" ranging from 10⁻¹ to 10². The X-axis is labeled "Operation Intensity (FLOPS/Byte)" ranging from 10⁻¹ to 10². Data points are labeled with system names and their type (Neuro or Symb). A diagonal line represents a performance roofline.
### Detailed Analysis
#### **Panel (a): Runtime Percentage Breakdown**
This chart shows the proportion of runtime spent on Neuro vs. Symbolic components for 14 different systems/tasks.
* **IMO:** Neuro ~32.6%, Symbolic ~67.4%
* **MiniF:** Neuro ~39.8%, Symbolic ~60.2%
* **2F:** Neuro ~36.5%, Symbolic ~63.5%
* **TwinS:** Neuro ~33.2%, Symbolic ~66.8%
* **XSTest:** Neuro ~42.1%, Symbolic ~57.9%
* **Mod:** Neuro ~63.4%, Symbolic ~36.6%
* **ComGen:** Neuro ~65.1%, Symbolic ~34.9%
* **Review:** Neuro ~61.6%, Symbolic ~38.4%
* **News:** Neuro ~36.1%, Symbolic ~63.9%
* **ComGen (2nd instance):** Neuro ~39.9%, Symbolic ~60.1%
* **TextF:** Neuro ~32.3%, Symbolic ~67.7%
* **Math:** Neuro ~49.5%, Symbolic ~50.5%
* **AwA2:** Neuro ~66.0%, Symbolic ~34.0%
* **FOLIO:** Neuro ~64.3%, Symbolic ~35.7%
* **Proof:** Neuro ~64.3%, Symbolic ~35.7% (Note: This appears to be a duplicate label for the last bar, which is visually identical to the FOLIO bar).
**Trend:** The Neuro component's runtime share varies significantly, from a low of ~32.3% (TextF) to a high of ~66.0% (AwA2). Systems like Mod, ComGen, Review, AwA2, FOLIO, and Proof are Neuro-dominant (>50% Neuro runtime). Others like IMO, MiniF, 2F, TwinS, XSTest, News, and TextF are Symbolic-dominant.
#### **Panel (b): Runtime Latency by Model Size**
This chart compares the total runtime latency (in minutes) for "Small" and "Large" model variants across five systems and five tasks.
* **Alpha:**
* Task IMO: Small ~5.5 min, Large ~10 min
* Task Safety: Small ~2.5 min, Large ~7 min
* **R²-G:**
* Task CoGen: Small ~4.8 min, Large ~9.5 min
* Task Text: Small ~4 min, Large ~9 min
* **GeLaTo:** Task FOLIO: Small ~5 min, Large ~10.5 min
* **Ctrl-G:** (Data for specific tasks not fully labeled on bars, but bars are present)
* **LINC:** (Data for specific tasks not fully labeled on bars, but bars are present)
**Trend:** For all visible paired comparisons (Alpha-IMO, Alpha-Safety, R²-G-CoGen, R²-G-Text, GeLaTo-FOLIO), the "Large" model variant consistently has a higher runtime latency than the "Small" variant, often approximately double. The Neuro (red) portion of the latency also increases with model size.
#### **Panel (c): Runtime Latency by Hardware**
This chart compares runtime latency on two hardware platforms (A6000 GPU and Orin SoC) for two systems.
* **Alpha:**
* Task MiniF: A6000 ~4 min, Orin ~20 min
* Task XSTest: A6000 ~3 min, Orin ~19 min
* **R²-G:** (Bars are present but specific task labels are not visible on the X-axis for this group).
**Trend:** There is a dramatic increase in runtime latency when moving from the A6000 GPU to the Orin platform for the Alpha system. The latency on Orin is approximately 4-5 times higher than on A6000 for both tasks shown. The Symbolic (green) component constitutes the majority of the latency on both platforms.
#### **Panel (d): Performance Roofline Analysis**
This scatter plot maps various systems on an Operation Intensity vs. Attainable Performance plane.
* **Data Points (Approximate Coordinates):**
* **LLaMA-3-8B (Neuro):** (~15 FLOPS/Byte, ~15 TFLOPS/s) - Highest performance, high intensity.
* **AlphaGeo (Symb):** (~2 FLOPS/Byte, ~8 TFLOPS/s)
* **LINC (Symb):** (~0.5 FLOPS/Byte, ~1.5 TFLOPS/s)
* **Ctrl-G (Symb):** (~8 FLOPS/Byte, ~1.2 TFLOPS/s)
* **R²-Guard (Symb):** (~5 FLOPS/Byte, ~0.8 TFLOPS/s)
* **GeLaTo (Symb):** (~0.8 FLOPS/Byte, ~0.1 TFLOPS/s)
* **NeuroPC (Symb):** (~1.5 FLOPS/Byte, ~0.15 TFLOPS/s)
* Several other unlabeled green (Symbolic) points are clustered between 0.5-5 FLOPS/Byte and 0.1-1 TFLOPS/s.
**Trend:** Neuro systems (only LLaMA-3-8B shown) achieve significantly higher attainable performance and operate at higher operation intensity compared to the plotted Symbolic systems. The Symbolic systems are distributed across a lower performance band (0.1 to ~8 TFLOPS/s) and generally lower operation intensity. The diagonal roofline suggests a memory-bound region (lower left) and a compute-bound region (upper right).
### Key Observations
1. **Neuro/Symbolic Trade-off:** Panel (a) reveals a clear dichotomy: some tasks are dominated by Neuro computation, others by Symbolic. This suggests fundamental architectural differences in how these systems approach different problem types.
2. **Scalability Cost:** Panel (b) shows a consistent and significant latency penalty for scaling from "Small" to "Large" models across multiple tasks and systems.
3. **Hardware Disparity:** Panel (c) highlights a massive performance gap between high-end GPU (A6000) and embedded SoC (Orin) hardware, with latency increasing by a factor of 4-5x.
4. **Performance Frontier:** Panel (d) indicates that the evaluated Neuro system (LLaMA-3-8B) operates on a different performance frontier than the Symbolic systems, achieving higher throughput at higher operational intensity.
### Interpretation
This composite figure provides a multi-faceted analysis of Neuro-Symbolic AI system performance. The data suggests that:
* **Task Specialization:** The choice between Neuro and Symbolic approaches is not universal but highly task-dependent (Panel a). This implies hybrid systems might dynamically allocate resources based on the sub-task.
* **The Cost of Scale:** Increasing model size ("Small" to "Large") comes with a predictable and substantial runtime cost (Panel b), which must be weighed against potential accuracy gains.
* **Deployment Constraints:** Hardware platform choice (Panel c) is a critical factor, with embedded systems (Orin) incurring severe latency penalties compared to datacenter GPUs (A6000), impacting real-time application feasibility.
* **Architectural Efficiency:** The roofline analysis (Panel d) suggests current Symbolic systems are less efficient at utilizing available computational throughput (lower TFLOPS/s) and have lower operational intensity, making them potentially more memory-bound. The Neuro system demonstrates a more compute-bound profile. This gap highlights an area for optimization in Symbolic or hybrid architectures.
The overall narrative points to a complex design space where task requirements, model scale, hardware constraints, and architectural paradigm (Neuro vs. Symbolic) must be co-optimized for efficient AI system deployment.
DECODING INTELLIGENCE...