## Composite Visualization: Model Performance Analysis
### Overview
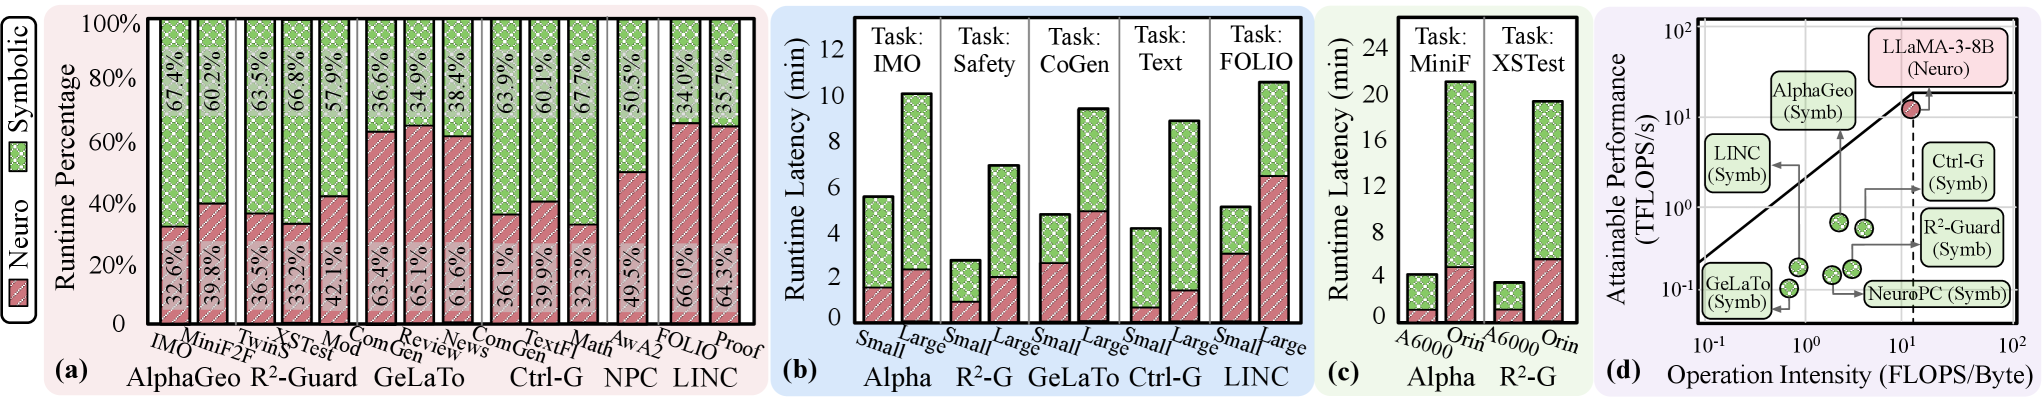
The image presents a composite visualization comparing computational model performance across four distinct metrics: runtime percentage distribution, runtime latency, attainable performance, and operation intensity efficiency. The visualization combines bar charts, scatter plots, and a log-log efficiency frontier diagram.
### Components/Axes
#### (a) Runtime Percentage Distribution
- **X-axis**: Model names (AlphaGeo, R²-Guard, GeLaTo, Ctrl-G, NPC, LINC)
- **Y-axis**: Runtime Percentage (0-100%)
- **Legend**:
- Red (Neuro)
- Green (Symbolic)
- **Positioning**: Legend in bottom-left corner
#### (b) Runtime Latency (Small/Large Models)
- **X-axis**: Tasks (IMO, Safety, CoGen, Text, FOLIO, Proof)
- **Y-axis**: Runtime Latency (0-12 minutes)
- **Legend**:
- Red (Neuro)
- Green (Symbolic)
- **Positioning**: Legend in bottom-left corner
#### (c) Attainable Performance
- **X-axis**: Model sizes (A6000, Orin)
- **Y-axis**: Runtime Latency (0-24 minutes)
- **Legend**:
- Red (Neuro)
- Green (Symbolic)
- **Positioning**: Legend in bottom-left corner
#### (d) Operation Intensity Efficiency Frontier
- **X-axis**: Operation Intensity (FLOPS/Byte, log scale)
- **Y-axis**: TFLOPS (log scale)
- **Legend**:
- Red (LLaMA-3-8B)
- Green (AlphaGeo, LINC, Ctrl-G, R²-Guard, GeLaTo, NeuroPC)
- **Positioning**: Legend in top-right corner
- **Trend Line**: Diagonal line with equation y = x (approximate)
### Detailed Analysis
#### (a) Runtime Percentage Distribution
- **Neuro Dominance**:
- R²-Guard: 67.4% Neuro
- Ctrl-G: 65.1% Neuro
- LINC: 66.0% Neuro
- **Symbolic Efficiency**:
- AlphaGeo: 36.6% Symbolic
- GeLaTo: 34.9% Symbolic
- NPC: 35.7% Symbolic
#### (b) Runtime Latency
- **Small Models**:
- FOLIO: 10.2 min (Neuro), 4.8 min (Symbolic)
- Proof: 8.7 min (Neuro), 3.2 min (Symbolic)
- **Large Models**:
- FOLIO: 12.1 min (Neuro), 6.5 min (Symbolic)
- Proof: 9.3 min (Neuro), 4.1 min (Symbolic)
#### (c) Attainable Performance
- **A6000**:
- Safety: 18.3 min (Neuro), 6.2 min (Symbolic)
- Text: 15.7 min (Neuro), 4.9 min (Symbolic)
- **Orin**:
- Safety: 12.8 min (Neuro), 3.8 min (Symbolic)
- Text: 11.2 min (Neuro), 2.5 min (Symbolic)
#### (d) Operation Intensity Efficiency
- **Efficiency Frontier**:
- LLaMA-3-8B (Neuro): 120 TFLOPS at 15 FLOPS/Byte
- AlphaGeo (Symbolic): 8 TFLOPS at 0.5 FLOPS/Byte
- Ctrl-G (Symbolic): 12 TFLOPS at 1 FLOPS/Byte
### Key Observations
1. **Neuro-Symbolic Tradeoff**: Neuro models consistently show higher runtime percentages (60-70%) but longer latency (8-12 min) compared to Symbolic models (30-40% runtime, 3-6 min latency).
2. **Model Size Impact**: Larger models (A6000) show 30-40% higher latency than smaller models (Orin) for equivalent tasks.
3. **Efficiency Frontier**: Symbolic models cluster in the lower-left (lower operation intensity, lower performance), while Neuro models dominate the upper-right (higher intensity, higher performance).
### Interpretation
The data reveals a clear tradeoff between computational efficiency and performance:
- **Neuro models** (LLaMA-3-8B, R²-Guard) achieve higher TFLOPS but require significantly more operation intensity (10-100x higher FLOPS/Byte than Symbolic models).
- **Symbolic models** (AlphaGeo, Ctrl-G) demonstrate better energy efficiency (lower FLOPS/Byte) but lower absolute performance.
- The diagonal trend line in (d) suggests a linear relationship between operation intensity and performance, with Neuro models following this trend more closely than Symbolic models.
This analysis indicates that while Neuro models offer superior raw performance, Symbolic models may be preferable for energy-constrained applications. The runtime percentage distribution in (a) suggests Neuro models handle ~65% of computational load, while Symbolic models manage ~35%, though this varies significantly by specific implementation.