\n
## Line Chart: Interestingness vs. Number of Steps
### Overview
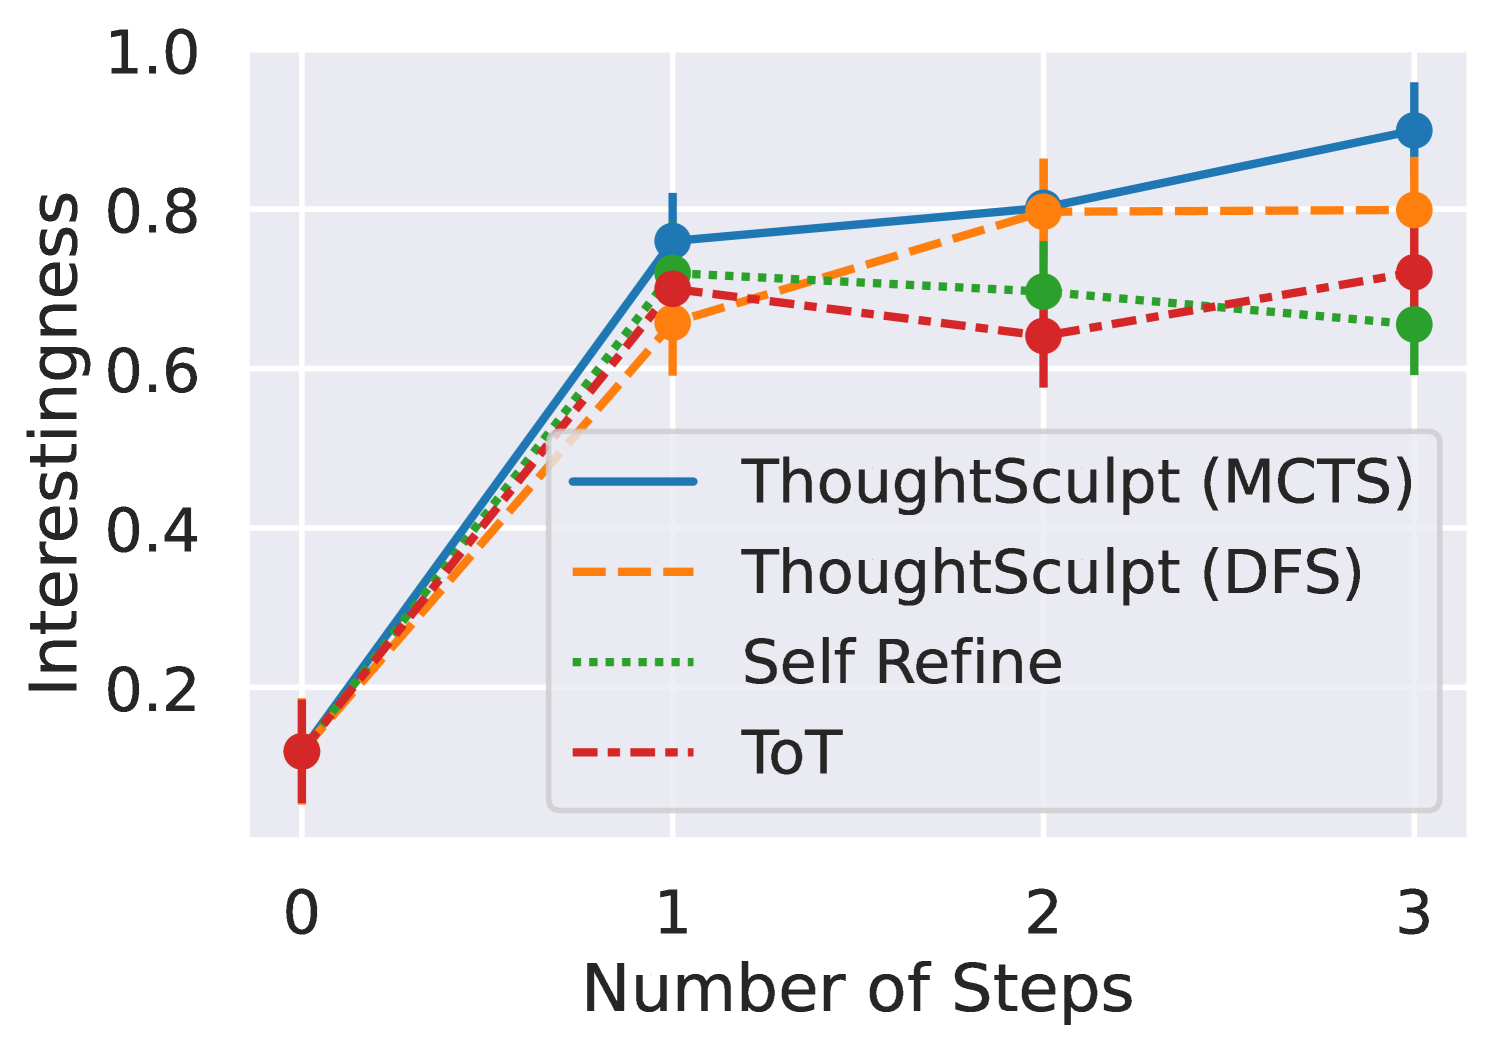
The image presents a line chart illustrating the relationship between the "Number of Steps" and "Interestingness" for four different methods: ThoughtSculpt (MCTS), ThoughtSculpt (DFS), Self Refine, and ToT. The chart displays how the interestingness of each method changes as the number of steps increases from 0 to 3. Error bars are present for each data point, indicating the variability or uncertainty in the measurements.
### Components/Axes
* **X-axis:** "Number of Steps" ranging from 0 to 3. Markers are present at 0, 1, 2, and 3.
* **Y-axis:** "Interestingness" ranging from 0.0 to 1.0. Markers are present at 0.0, 0.2, 0.4, 0.6, 0.8, and 1.0.
* **Legend:** Located in the top-right corner, identifying the four data series:
* ThoughtSculpt (MCTS) - Solid Blue Line
* ThoughtSculpt (DFS) - Dashed Orange Line
* Self Refine - Dotted Green Line
* ToT - Dashed Red Line
* **Error Bars:** Vertical lines extending above and below each data point, representing the standard error or confidence interval.
### Detailed Analysis
Here's a breakdown of each data series, with approximate values extracted from the chart:
* **ThoughtSculpt (MCTS) - Solid Blue Line:** This line shows a generally upward trend.
* Step 0: Interestingness ≈ 0.15 ± 0.05
* Step 1: Interestingness ≈ 0.72 ± 0.04
* Step 2: Interestingness ≈ 0.78 ± 0.03
* Step 3: Interestingness ≈ 0.86 ± 0.03
* **ThoughtSculpt (DFS) - Dashed Orange Line:** This line initially increases sharply, then plateaus.
* Step 0: Interestingness ≈ 0.18 ± 0.04
* Step 1: Interestingness ≈ 0.70 ± 0.05
* Step 2: Interestingness ≈ 0.78 ± 0.04
* Step 3: Interestingness ≈ 0.79 ± 0.03
* **Self Refine - Dotted Green Line:** This line shows a moderate increase, with some fluctuation.
* Step 0: Interestingness ≈ 0.20 ± 0.05
* Step 1: Interestingness ≈ 0.65 ± 0.04
* Step 2: Interestingness ≈ 0.68 ± 0.04
* Step 3: Interestingness ≈ 0.66 ± 0.03
* **ToT - Dashed Red Line:** This line increases initially, then decreases slightly.
* Step 0: Interestingness ≈ 0.15 ± 0.04
* Step 1: Interestingness ≈ 0.60 ± 0.05
* Step 2: Interestingness ≈ 0.65 ± 0.04
* Step 3: Interestingness ≈ 0.63 ± 0.03
### Key Observations
* ThoughtSculpt (MCTS) consistently exhibits the highest interestingness values, especially at higher step counts.
* ThoughtSculpt (DFS) shows a rapid initial increase in interestingness, but its improvement slows down after Step 2.
* Self Refine and ToT have similar interestingness levels, remaining relatively stable after Step 1.
* All methods start with low interestingness values at Step 0.
* The error bars suggest that the measurements for ThoughtSculpt (MCTS) are more consistent than those for the other methods.
### Interpretation
The chart demonstrates the impact of iterative steps on the "interestingness" of different methods. ThoughtSculpt (MCTS) appears to be the most effective method for increasing interestingness as the number of steps increases. The initial rapid increase in interestingness for ThoughtSculpt (DFS) suggests that it quickly identifies promising solutions, but its subsequent plateau indicates that further steps do not yield significant improvements. Self Refine and ToT show moderate improvements, but their performance is less pronounced than that of the ThoughtSculpt methods.
The error bars provide insight into the reliability of the measurements. The smaller error bars for ThoughtSculpt (MCTS) suggest that its performance is more consistent and predictable. The larger error bars for the other methods indicate greater variability in their results.
This data could be used to inform the selection of methods for tasks where maximizing interestingness is a key objective. The chart suggests that ThoughtSculpt (MCTS) is a strong candidate for such tasks, particularly when multiple iterative steps are feasible.