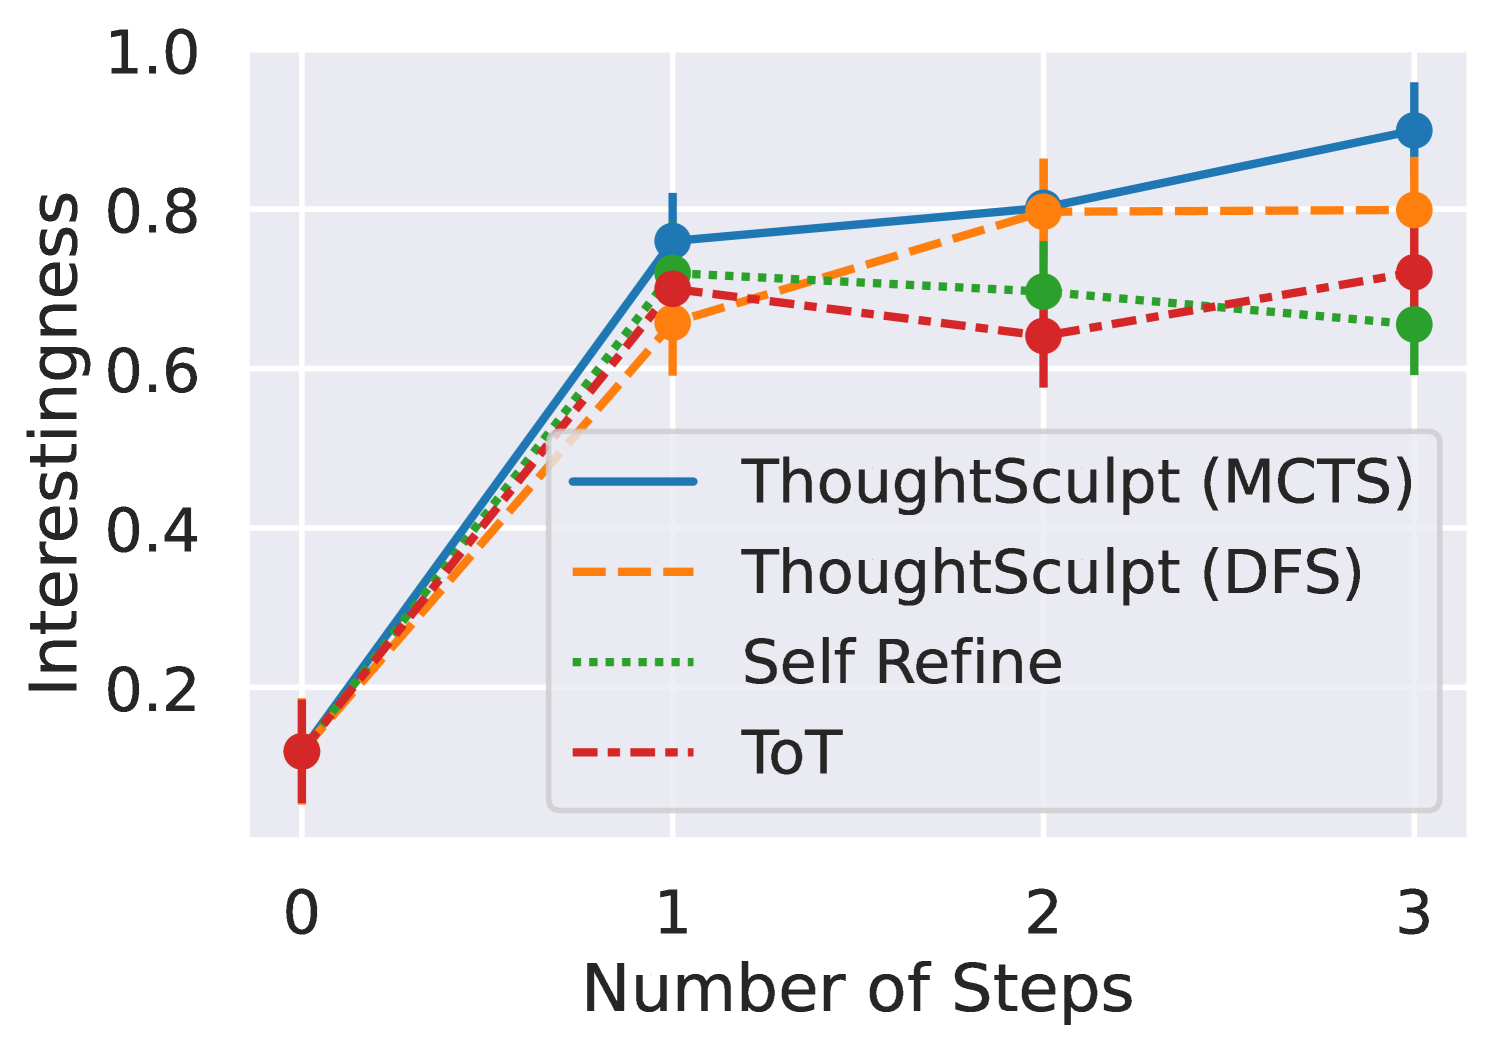
## Line Graph: Interestingness vs. Number of Steps
### Overview
The image is a line graph comparing the "Interestingness" metric across four different methods (ThoughtSculpt (MCTS), ThoughtSculpt (DFS), Self Refine, and ToT) as a function of the "Number of Steps" (0 to 3). The y-axis ranges from 0 to 1, and the x-axis is labeled "Number of Steps." The graph includes a legend with color-coded lines and markers for each method.
### Components/Axes
- **X-axis**: "Number of Steps" (0, 1, 2, 3)
- **Y-axis**: "Interestingness" (0 to 1)
- **Legend**:
- **Blue solid line**: ThoughtSculpt (MCTS)
- **Orange dashed line**: ThoughtSculpt (DFS)
- **Green dotted line**: Self Refine
- **Red dash-dot line**: ToT
- **Data Points**: Markers (circles) at each step for all methods.
### Detailed Analysis
- **ThoughtSculpt (MCTS)** (Blue solid line):
- Starts at ~0.1 at step 0.
- Increases sharply to ~0.75 at step 1.
- Rises to ~0.8 at step 2.
- Peaks at ~0.9 at step 3.
- **ThoughtSculpt (DFS)** (Orange dashed line):
- Starts at ~0.1 at step 0.
- Rises to ~0.65 at step 1.
- Increases to ~0.8 at step 2.
- Plateaus at ~0.8 at step 3.
- **Self Refine** (Green dotted line):
- Starts at ~0.1 at step 0.
- Rises to ~0.7 at step 1.
- Drops to ~0.65 at step 2.
- Slightly decreases to ~0.65 at step 3.
- **ToT** (Red dash-dot line):
- Starts at ~0.1 at step 0.
- Rises to ~0.6 at step 1.
- Drops to ~0.6 at step 2.
- Increases to ~0.7 at step 3.
### Key Observations
1. **ThoughtSculpt (MCTS)** consistently outperforms other methods, showing the steepest and highest growth.
2. **ThoughtSculpt (DFS)** and **Self Refine** exhibit similar trends but with different magnitudes: DFS peaks earlier and plateaus, while Self Refine peaks at step 1 and declines.
3. **ToT** shows a delayed increase, with a notable rise at step 3 compared to its earlier steps.
4. All methods start at the same low value (~0.1) at step 0, indicating a baseline similarity.
### Interpretation
The data suggests that **ThoughtSculpt (MCTS)** is the most effective method for maximizing "Interestingness" across steps, likely due to its iterative refinement process (MCTS). **ThoughtSculpt (DFS)** and **Self Refine** demonstrate trade-offs: DFS prioritizes early gains but plateaus, while Self Refine achieves higher initial values but declines over time. **ToT**’s late increase may indicate a delayed optimization effect or a specific mechanism that becomes more impactful at later steps. The graph highlights the importance of method selection based on the desired balance between early performance and long-term growth.
### Spatial Grounding
- The legend is positioned in the **bottom-right corner**, clearly associating colors with methods.
- Data points (circles) are placed at the intersection of each step and method, with error bars (vertical lines) indicating uncertainty.
- The x-axis and y-axis are labeled in the **bottom-left** and **top-left** corners, respectively.
### Content Details
- **Values**:
- Step 0: All methods ~0.1.
- Step 1: MCTS ~0.75, DFS ~0.65, Self Refine ~0.7, ToT ~0.6.
- Step 2: MCTS ~0.8, DFS ~0.8, Self Refine ~0.65, ToT ~0.6.
- Step 3: MCTS ~0.9, DFS ~0.8, Self Refine ~0.65, ToT ~0.7.
- **Trends**:
- MCTS shows a **linear upward trend**.
- DFS and Self Refine exhibit **non-linear growth** with peaks and plateaus.
- ToT has a **delayed increase** at step 3.
### Notable Anomalies
- **Self Refine**’s decline after step 1 is unusual, suggesting potential overfitting or diminishing returns.
- **ToT**’s late increase at step 3 may indicate a hidden mechanism or a specific condition not captured in earlier steps.
### Final Notes
The graph provides a clear comparison of method performance, emphasizing the superiority of MCTS. However, the exact nature of "Interestingness" and the underlying mechanisms of each method are not explained, leaving room for further investigation. The data underscores the need for context-specific method selection in optimization tasks.