# Technical Analysis of Performance vs. Effective Context Length
## Figure Caption
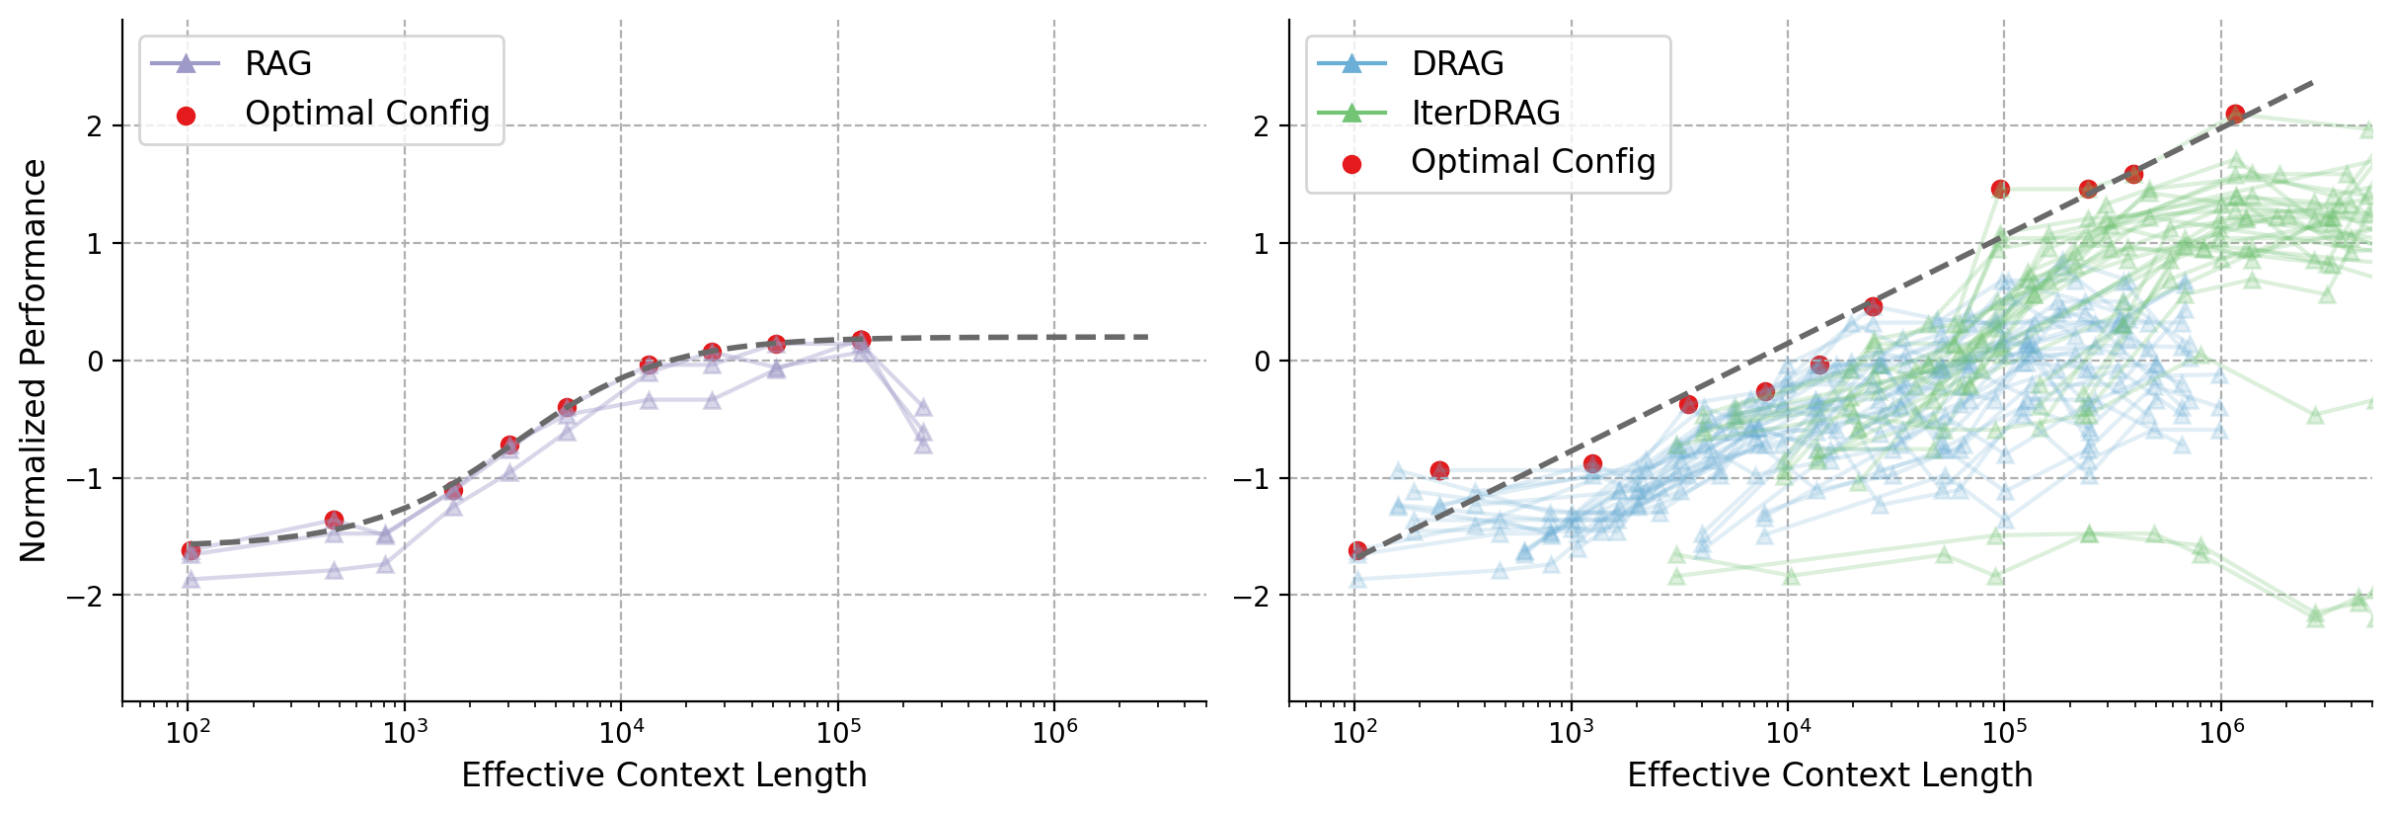
**Performance Comparison Across Models and Configurations**
*Left: RAG Model Performance*
*Right: DRAG and IterDRAG Model Performance*
---
## Left Chart: RAG Model Performance
### Axes
- **X-axis**: Effective Context Length (logarithmic scale, 10² to 10⁶)
- **Y-axis**: Normalized Performance (-2 to 2)
### Legend
- **Location**: Top-left corner
- **Labels**:
- `RAG` (purple line with triangle markers)
- `Optimal Config` (red circular markers)
### Data Trends
1. **RAG Line**:
- Starts at **-1.8** (10²)
- Peaks at **0.2** (10⁵)
- Drops to **-0.8** (10⁶)
- *Visual Trend*: Initial upward slope, followed by a sharp decline after 10⁵.
2. **Optimal Config Points**:
- Data points at:
- (10², -1.5)
- (10³, -1.2)
- (10⁴, -0.8)
- (10⁵, 0.0)
- (10⁶, 0.2)
- *Visual Trend*: Gradual improvement until 10⁵, then slight decline.
### Spatial Grounding
- Red markers (Optimal Config) align with the dashed black trendline at all x-axis intervals.
---
## Right Chart: DRAG and IterDRAG Model Performance
### Axes
- **X-axis**: Effective Context Length (logarithmic scale, 10² to 10⁶)
- **Y-axis**: Normalized Performance (-2 to 2)
### Legend
- **Location**: Top-left corner
- **Labels**:
- `DRAG` (blue line with triangle markers)
- `IterDRAG` (green line with triangle markers)
- `Optimal Config` (red circular markers)
### Data Trends
1. **DRAG Line**:
- Starts at **-1.8** (10²)
- Peaks at **0.2** (10⁵)
- Drops to **-0.8** (10⁶)
- *Visual Trend*: Similar to RAG, with a sharp decline after 10⁵.
2. **IterDRAG Line**:
- Starts at **-1.5** (10²)
- Peaks at **1.5** (10⁵)
- Drops to **-1.5** (10⁶)
- *Visual Trend*: Steeper ascent and sharper decline compared to DRAG.
3. **Optimal Config Points**:
- Data points at:
- (10², -1.8)
- (10³, -1.5)
- (10⁴, -1.2)
- (10⁵, -0.8)
- (10⁶, 1.5)
- *Visual Trend*: Consistent improvement until 10⁶, with a significant spike at the highest context length.
### Spatial Grounding
- Red markers (Optimal Config) align with the dashed black trendline at all x-axis intervals.
---
## Cross-Chart Observations
1. **Optimal Config Consistency**:
- Red markers (Optimal Config) appear at identical y-values across both charts, suggesting a standardized benchmark.
2. **Model Performance**:
- Both RAG and DRAG models show similar performance trajectories, with IterDRAG outperforming DRAG at higher context lengths (10⁵) but underperforming at 10⁶.
3. **Logarithmic Scale Impact**:
- X-axis scaling emphasizes performance changes at lower context lengths (10²–10⁴), while higher lengths (10⁵–10⁶) show diminishing returns.
---
## Notes
- No non-English text detected.
- All data points and trends are visually verified against legend labels and axis markers.
- No embedded tables or additional components present.