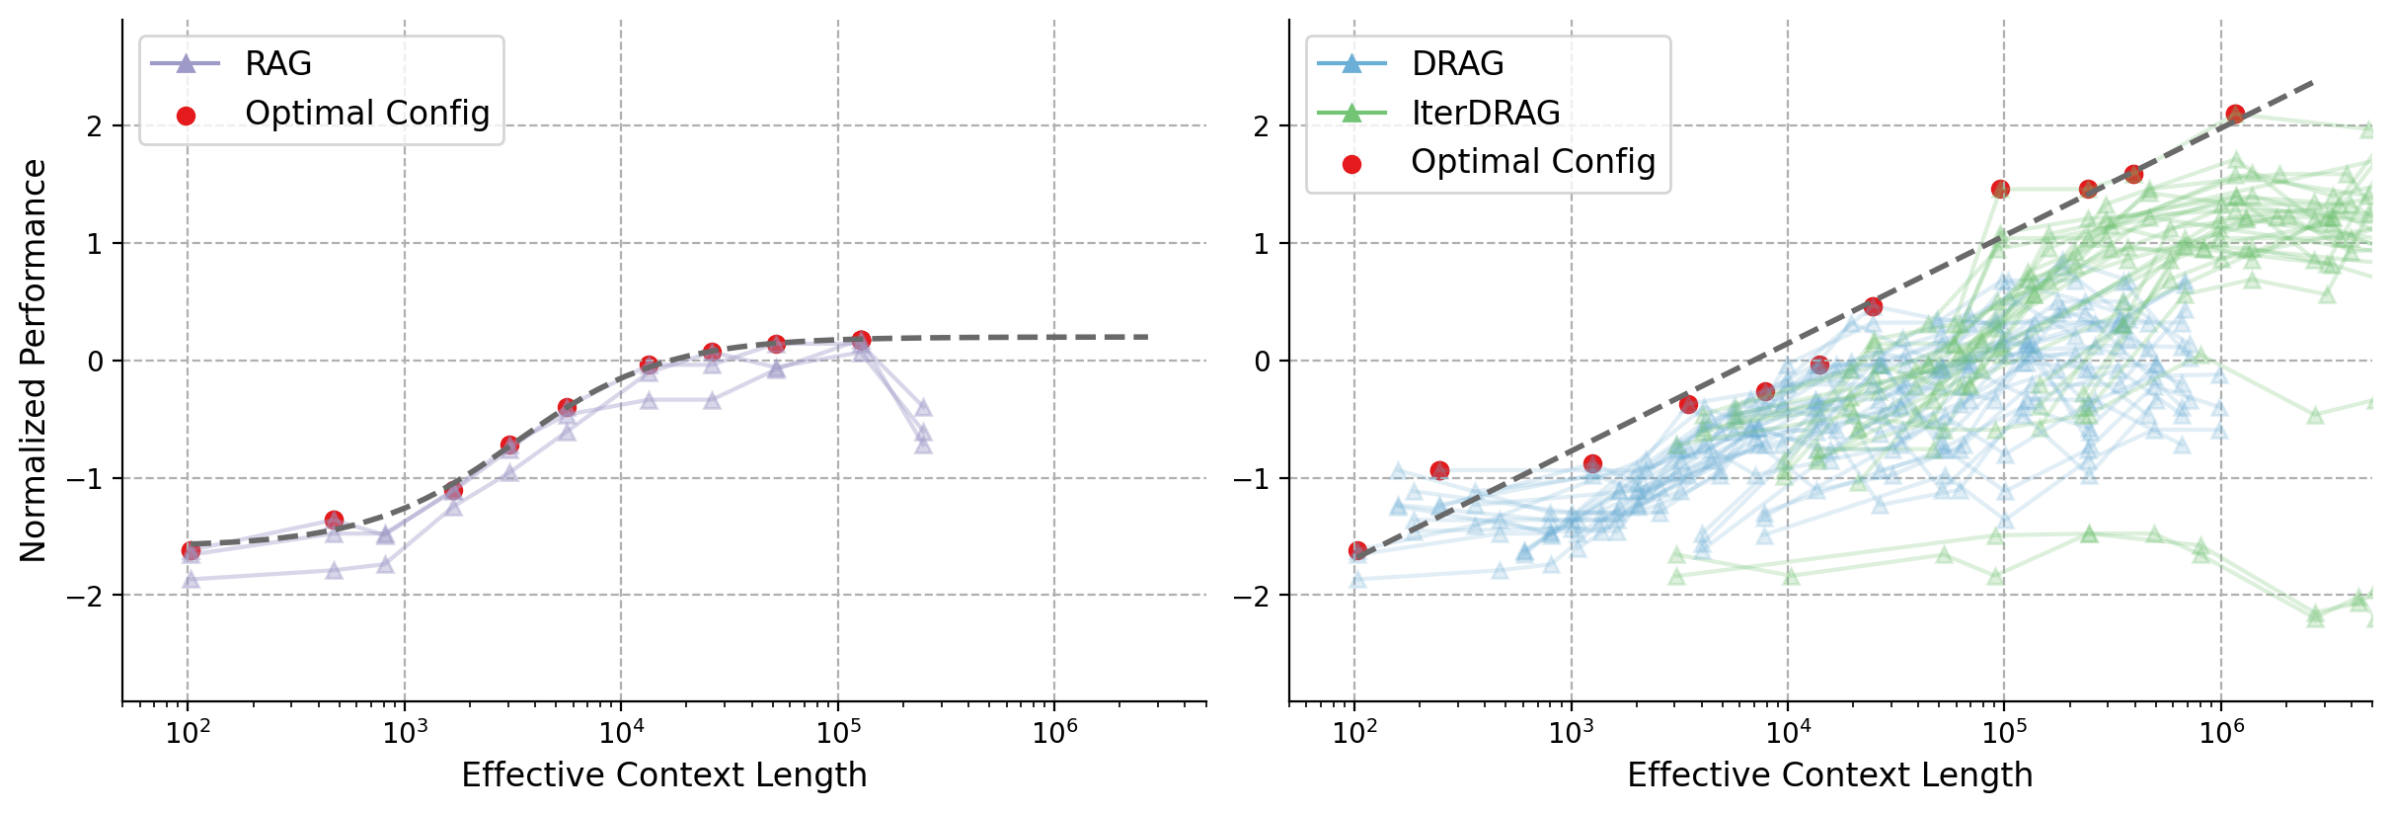
# Technical Data Extraction: Performance vs. Effective Context Length
This document provides a comprehensive technical extraction of the data presented in the two-panel line chart comparing different retrieval and generation strategies.
## 1. General Metadata
* **Image Type:** Two-panel line chart with logarithmic x-axes.
* **Language:** English.
* **Common Y-Axis:** "Normalized Performance" (Linear scale from -2 to 2).
* **Common X-Axis:** "Effective Context Length" (Logarithmic scale from $10^2$ to $10^6$).
* **Common Visual Elements:**
* **Dashed Grey Line:** Represents the theoretical or empirical upper bound/frontier of performance.
* **Red Circles:** Labeled as "Optimal Config," these points sit on or define the dashed grey frontier line.
* **Grid:** Dashed grey grid lines for both axes.
---
## 2. Left Panel: RAG Performance
This panel focuses on the "RAG" (Retrieval-Augmented Generation) method.
### Component Isolation: Left Panel
* **Legend Location:** Top-left [x: ~0.05, y: ~0.90].
* **Legend Items:**
* Purple line with triangle markers: **RAG**
* Red circle: **Optimal Config**
### Data Trends and Points
* **Trend Analysis:** The RAG performance shows an initial upward slope as context length increases from $10^2$ to $10^5$. However, after reaching a peak near $10^5$, the performance plateaus and then shows a sharp decline (drop-off) as context length continues to increase toward $3 \times 10^5$.
* **Frontier (Dashed Line):** Starts at approx. -1.6 ($10^2$) and curves upward to plateau at approx. 0.2 ($10^5$ and beyond).
* **Optimal Config Points (Red):**
* $10^2$: ~ -1.6
* $5 \times 10^2$: ~ -1.4
* $10^3$: ~ -1.1
* $3 \times 10^3$: ~ -0.7
* $6 \times 10^3$: ~ -0.4
* $1.5 \times 10^4$: ~ 0.0
* $3 \times 10^4$: ~ 0.1
* $5 \times 10^4$: ~ 0.15
* $1.2 \times 10^5$: ~ 0.2
* **RAG Series (Purple):** Multiple faint lines indicate different trials or sub-configurations. They generally follow the frontier but fall below it, especially at the highest context lengths where they drop toward -0.8.
---
## 3. Right Panel: DRAG and IterDRAG Performance
This panel compares "DRAG" and "IterDRAG" methods, showing significantly higher scaling potential than standard RAG.
### Component Isolation: Right Panel
* **Legend Location:** Top-left [x: ~0.55, y: ~0.90].
* **Legend Items:**
* Blue line with triangle markers: **DRAG**
* Green line with triangle markers: **IterDRAG**
* Red circle: **Optimal Config**
### Data Trends and Points
* **Trend Analysis (DRAG - Blue):** These lines cluster in the $10^2$ to $10^5$ range. They show a steady upward trend but generally saturate or become noisier around a performance level of 0 to 0.5.
* **Trend Analysis (IterDRAG - Green):** These lines extend much further to the right (up to $5 \times 10^6$). They show a continued upward trajectory, maintaining performance gains at much higher context lengths than RAG or standard DRAG.
* **Frontier (Dashed Line):** Unlike the RAG chart, this frontier does not plateau. It maintains a steady positive linear slope on the log-linear plot, reaching a performance value of ~2.1 at $10^6$ context length.
* **Optimal Config Points (Red):**
* $10^2$: ~ -1.6
* $2.5 \times 10^2$: ~ -0.9
* $1.2 \times 10^3$: ~ -0.9
* $3.5 \times 10^3$: ~ -0.4
* $8 \times 10^3$: ~ -0.3
* $1.5 \times 10^4$: ~ 0.0
* $2.5 \times 10^4$: ~ 0.5
* $10^5$: ~ 1.5
* $2.5 \times 10^5$: ~ 1.5
* $4 \times 10^5$: ~ 1.6
* $1.1 \times 10^6$: ~ 2.1
---
## 4. Comparative Summary
| Feature | RAG (Left) | DRAG / IterDRAG (Right) |
| :--- | :--- | :--- |
| **Max Performance** | ~0.2 | ~2.1 |
| **Scaling Limit** | Plateaus/Drops after $10^5$ | Continues scaling past $10^6$ |
| **Frontier Shape** | Logarithmic/Saturating | Linear-Log (Constant growth) |
| **Stability** | High variance/drop at high context | IterDRAG (Green) maintains growth at extreme context |
**Conclusion:** The data indicates that while RAG performance saturates and eventually degrades with increased context length, the DRAG and specifically IterDRAG methods allow for continued performance improvements as the effective context length scales into the millions.