## Parabolic Curve Diagram: Labeled Points and Segments
### Overview
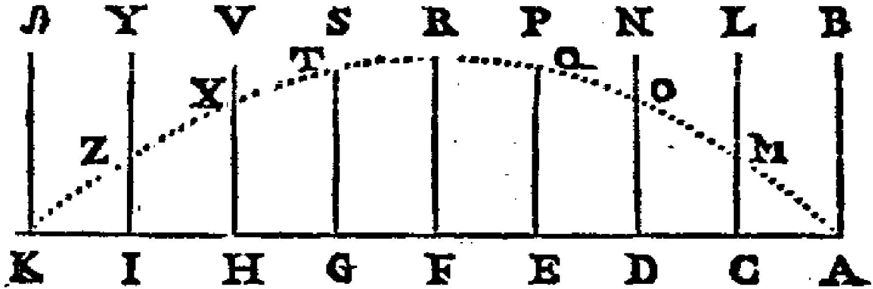
The image depicts a parabolic curve with labeled points and segmented vertical divisions. The curve is plotted on a coordinate system with labeled axes (x-axis: K to A; y-axis: J to B). The curve is divided into distinct segments by vertical dashed lines, and key points along the curve are labeled with uppercase letters (e.g., Z, X, T, Q, O, M). The curve peaks at points T and Q, then slopes downward toward M.
### Components/Axes
- **X-axis (Horizontal)**: Labeled with uppercase letters from **K** (leftmost) to **A** (rightmost).
- **Y-axis (Vertical)**: Labeled with uppercase letters from **J** (top) to **B** (bottom).
- **Curve**: A parabolic shape with a dotted line, peaking at **T** and **Q**, then declining to **M**.
- **Vertical Segments**: Dashed lines divide the curve into regions labeled with letters (e.g., **I**, **H**, **G**, **F**, **E**, **D**, **C**).
### Detailed Analysis
- **Curve Labels**:
- **Z**: Leftmost point on the curve, near the x-axis.
- **X**: First labeled point on the ascending slope.
- **T**: Peak of the curve (highest point).
- **Q**: Second peak (slightly lower than T).
- **O**: Point on the descending slope after Q.
- **M**: Rightmost point on the curve, near the x-axis.
- **Vertical Segments**:
- Segments are labeled **I**, **H**, **G**, **F**, **E**, **D**, **C** (from left to right).
- Each segment corresponds to a vertical division between the curve and the x-axis.
### Key Observations
1. **Symmetry**: The curve appears symmetric around the midpoint between T and Q.
2. **Peaks**: T and Q are the highest points, suggesting a bimodal distribution or dual maxima.
3. **Decline**: The curve slopes downward sharply after Q, ending at M.
4. **No Numerical Data**: The axes and curve lack numerical values, relying solely on alphabetical labels.
### Interpretation
- The diagram likely represents a conceptual or categorical relationship rather than a quantitative one, given the absence of numerical scales.
- The labels (e.g., Z, X, T, Q, O, M) may correspond to variables, categories, or stages in a process.
- The vertical segments (I, H, G, etc.) could denote intervals or thresholds between key points on the curve.
- The parabolic shape suggests a non-linear relationship between the x-axis (K to A) and y-axis (J to B) variables.
- The absence of a legend or numerical data limits quantitative analysis, but the structure implies a focus on qualitative or categorical distinctions.
## Notes
- **Language**: All text is in English.
- **Missing Elements**: No numerical values, units, or legends are present.
- **Assumptions**: The curve’s shape and labels are interpreted as abstract or symbolic rather than empirical data.