## Diagram: Federated Learning Process Flow
### Overview
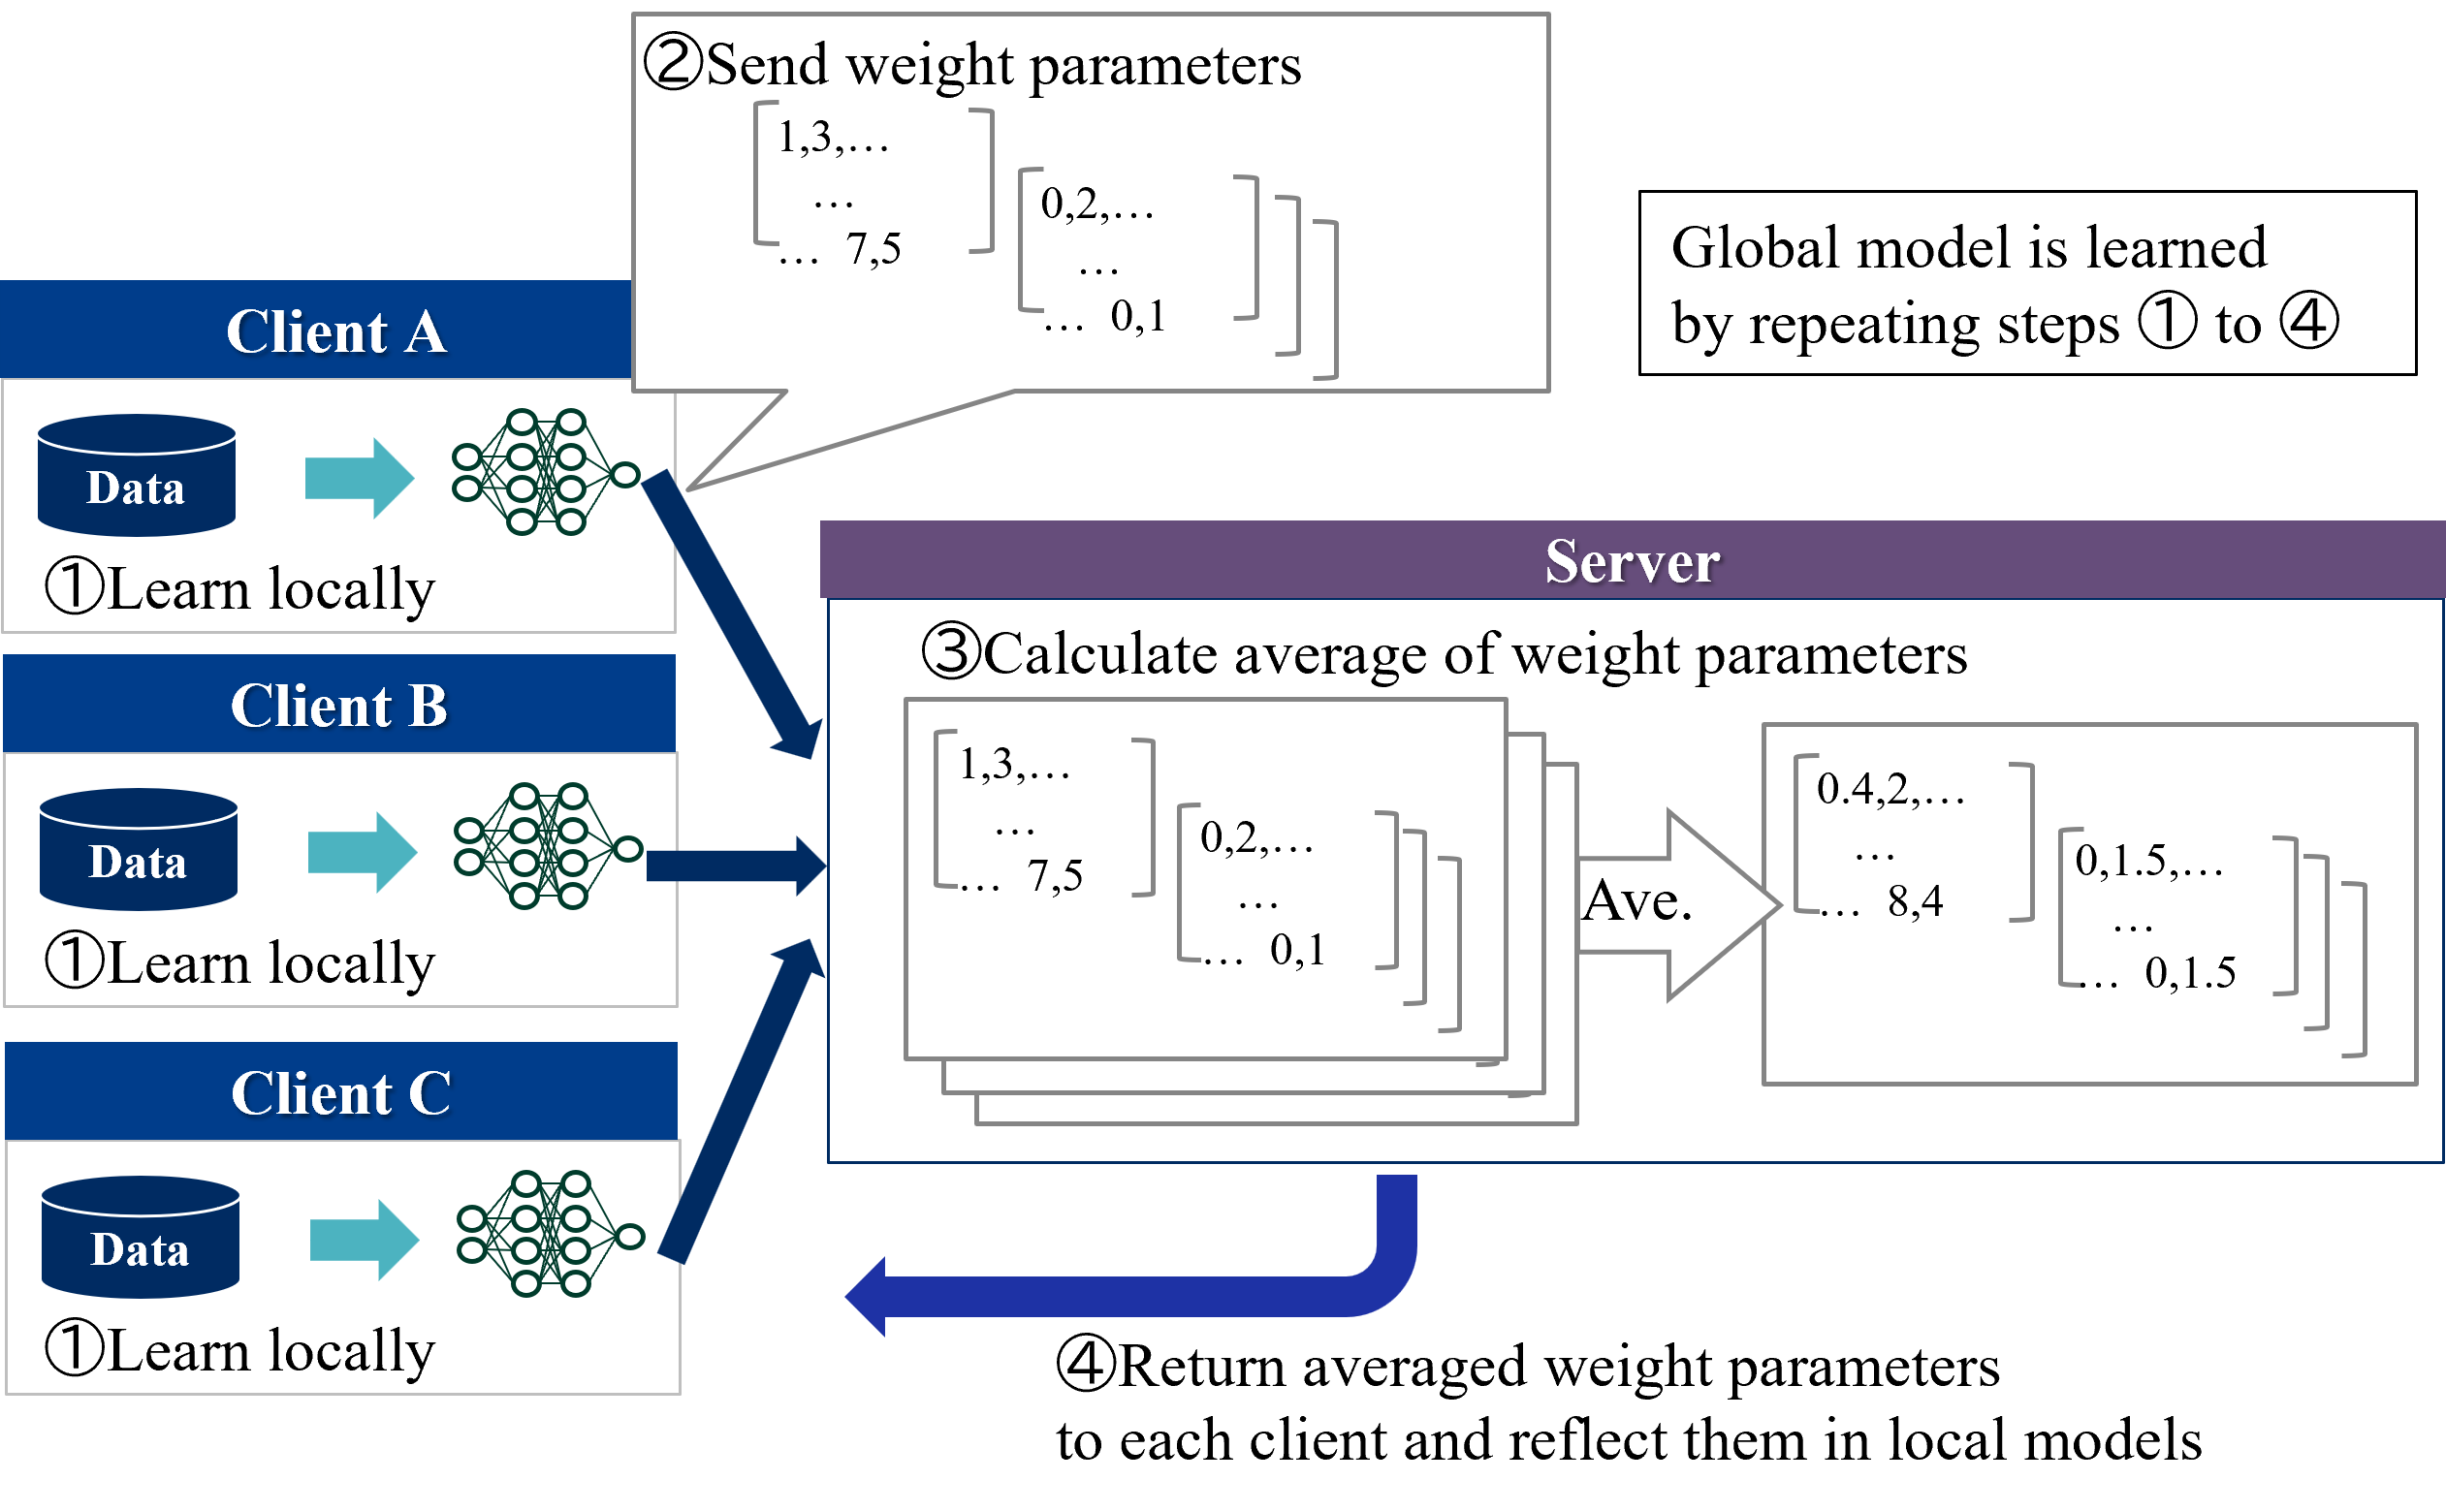
This image illustrates the iterative process of Federated Learning, a machine learning technique where a global model is trained across multiple decentralized edge devices (clients) holding local data samples, without exchanging the data itself. The diagram depicts the cycle of local training, parameter transmission, server-side aggregation, and the return of updated parameters to the clients.
### Components
The diagram is organized into three primary regions:
* **Left Region (Clients):** Three distinct blocks labeled "Client A", "Client B", and "Client C". Each block contains:
* A database icon labeled "Data".
* A neural network icon.
* The text label "1 Learn locally".
* **Center/Right Region (Server):** A large rectangular container with a purple header labeled "Server".
* Inside the server, there is a process block labeled "3 Calculate average of weight parameters".
* An "Ave." (Average) operation block.
* Input and output matrix representations.
* **Top-Right Region:** A text box stating: "Global model is learned by repeating steps 1 to 4".
* **Bottom Region:** A large blue arrow indicating the feedback loop, labeled "4 Return averaged weight parameters to each client and reflect them in local models".
### Detailed Analysis
#### Step 1: Local Learning
* **Location:** Left side, within each Client block.
* **Action:** Each client uses its local "Data" to train a local neural network.
* **Label:** "1 Learn locally".
#### Step 2: Sending Parameters
* **Location:** Top-center, originating from the Client A neural network icon.
* **Action:** A callout bubble points toward the Server.
* **Label:** "2 Send weight parameters".
* **Data Representation:** The bubble displays two matrix examples:
* Matrix 1: `[1,3,... / ... / ... 7,5]`
* Matrix 2: `[0,2,... / ... / ... 0,1]`
#### Step 3: Server Aggregation
* **Location:** Inside the Server box.
* **Action:** The server receives parameters from clients.
* **Label:** "3 Calculate average of weight parameters".
* **Process:** Multiple overlapping matrix stacks are fed into an "Ave." (Average) block.
* **Output:** The resulting averaged matrices are shown as:
* Matrix 1: `[0.4,2,... / ... / ... 8,4]`
* Matrix 2: `[0.1,5,... / ... / ... 0,1.5]`
#### Step 4: Feedback Loop
* **Location:** Bottom, spanning from the Server back to the Clients.
* **Action:** A large blue arrow indicates the return of the averaged weights.
* **Label:** "4 Return averaged weight parameters to each client and reflect them in local models".
### Key Observations
* **Cyclical Nature:** The diagram explicitly notes that the global model is learned by repeating steps 1 through 4, creating a continuous loop.
* **Data Privacy:** The diagram visually separates the "Data" (which stays inside the Client blocks) from the "weight parameters" (which are sent to the server). This highlights the privacy-preserving nature of Federated Learning, where raw data is never shared.
* **Aggregation Logic:** The "Ave." block is the central mathematical component, suggesting the use of a Federated Averaging (FedAvg) algorithm.
* **Numerical Placeholders:** The matrices shown (e.g., `[1,3,...]`) are illustrative placeholders representing the weight tensors of a neural network, rather than specific, real-world data values.
### Interpretation
This diagram provides a high-level architectural overview of Federated Learning.
* **Process Flow:** The logic follows a synchronous pattern: Clients compute gradients/weights locally, the server aggregates these weights to form a new global model, and the clients update their local models with this new global knowledge.
* **System Dynamics:** The "Ave." operation is the critical bottleneck and the point of intelligence for the server. By averaging the weights, the server effectively distills the knowledge learned from the disparate datasets of Clients A, B, and C into a single, more robust model.
* **Strategic Implication:** The diagram demonstrates that the "Global model" is an emergent property of the collective training process. The separation of the "Data" icon from the "weight parameters" flow is the most significant detail, as it visually confirms that the system is designed to protect user data privacy while still enabling collaborative machine learning.