## Line Charts: Performance Comparison of Prototypical and Frozen Models
### Overview
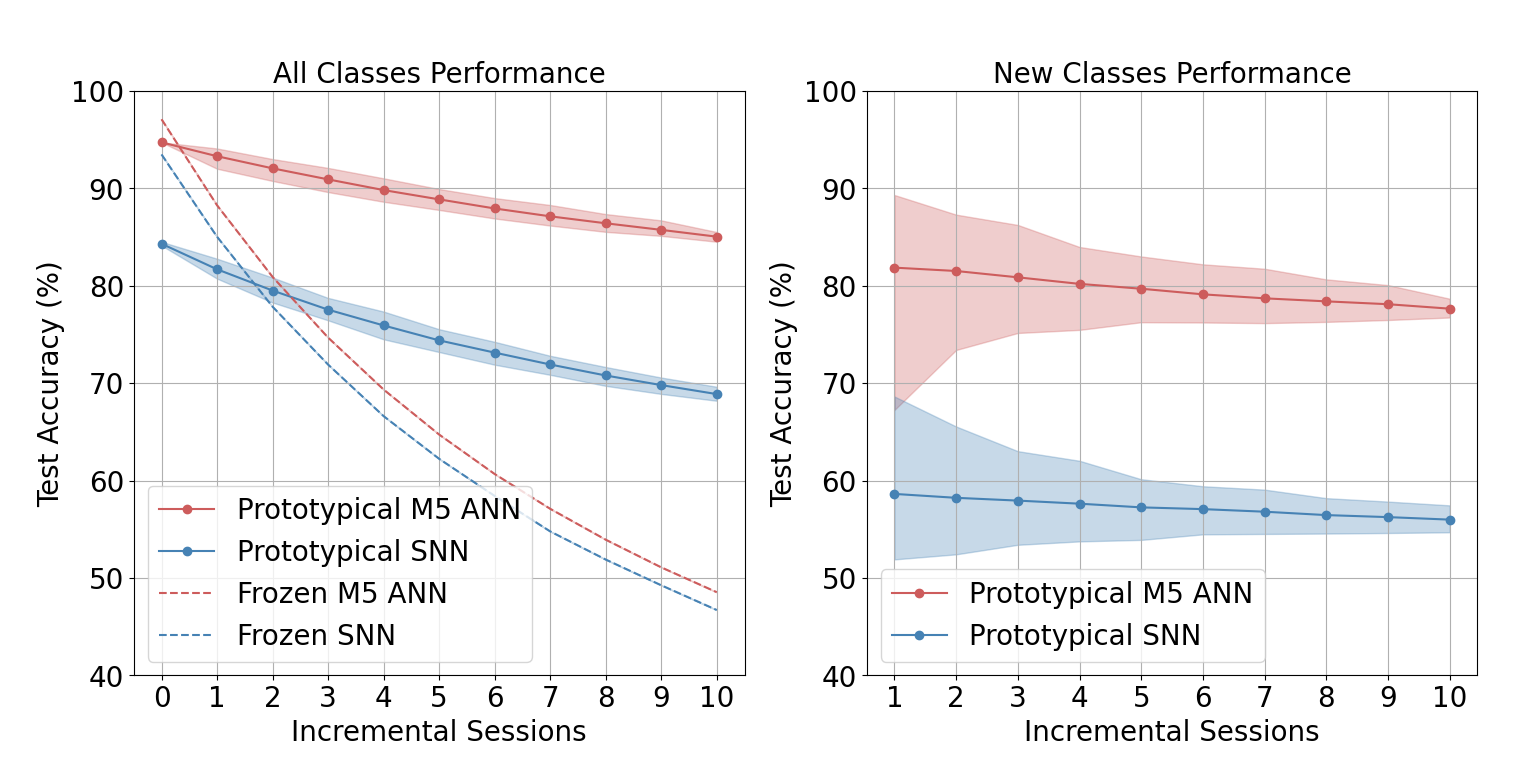
This image displays two line charts comparing the performance of four different machine learning model configurations ("Prototypical M5 ANN", "Prototypical SNN", "Frozen M5 ANN", and "Frozen SNN") across incremental learning sessions. The left chart illustrates performance on "All Classes," while the right chart illustrates performance on "New Classes." Both charts utilize shaded regions to represent variance or uncertainty around the mean performance values.
### Components/Axes
**Common Elements:**
* **Y-Axis:** Labeled "Test Accuracy (%)", ranging from 40 to 100.
* **Grid:** Both charts feature a light gray grid for easier value estimation.
**Left Chart: "All Classes Performance"**
* **X-Axis:** "Incremental Sessions", ranging from 0 to 10.
* **Legend (Bottom-Left):**
* **Prototypical M5 ANN:** Red solid line with circular markers.
* **Prototypical SNN:** Blue solid line with circular markers.
* **Frozen M5 ANN:** Red dashed line.
* **Frozen SNN:** Blue dashed line.
**Right Chart: "New Classes Performance"**
* **X-Axis:** "Incremental Sessions", ranging from 1 to 10.
* **Legend (Bottom-Left):**
* **Prototypical M5 ANN:** Red solid line with circular markers.
* **Prototypical SNN:** Blue solid line with circular markers.
---
### Detailed Analysis
#### Left Chart: All Classes Performance
* **Trend Verification:** The "Prototypical" models (solid lines) show a gradual, linear-like decline. The "Frozen" models (dashed lines) show a steep, exponential-like decay.
* **Prototypical M5 ANN (Red Solid):** Starts at approximately 95% at session 0. It declines steadily to approximately 85% by session 10.
* **Prototypical SNN (Blue Solid):** Starts at approximately 84% at session 0. It declines steadily to approximately 69% by session 10.
* **Frozen M5 ANN (Red Dashed):** Starts at approximately 97% at session 0. It drops sharply, reaching ~75% by session 4, and continues to fall to approximately 48% by session 10.
* **Frozen SNN (Blue Dashed):** Starts at approximately 93% at session 0. It drops sharply, reaching ~67% by session 4, and continues to fall to approximately 47% by session 10.
#### Right Chart: New Classes Performance
* **Trend Verification:** Both models show a very slight, gradual decline across the sessions.
* **Prototypical M5 ANN (Red Solid):** Starts at approximately 82% at session 1. It maintains a high level of performance, ending at approximately 78% by session 10.
* **Prototypical SNN (Blue Solid):** Starts at approximately 59% at session 1. It maintains a lower, but stable performance, ending at approximately 56% by session 10.
---
### Key Observations
* **Catastrophic Forgetting:** The "Frozen" models (left chart) exhibit severe performance degradation, characteristic of catastrophic forgetting in incremental learning, where the model loses the ability to classify previous classes as new ones are added.
* **Stability:** The "Prototypical" models demonstrate significantly higher stability in both "All Classes" and "New Classes" scenarios compared to the "Frozen" counterparts.
* **Model Superiority:** In all observed scenarios, the "M5 ANN" architecture consistently outperforms the "SNN" architecture.
* **Variance:** The shaded regions indicate that the "Prototypical M5 ANN" has a tighter variance (more consistent performance) in the "All Classes" chart compared to the "Prototypical SNN." In the "New Classes" chart, the "Prototypical M5 ANN" shows a wider variance (shaded red area) compared to the "Prototypical SNN" (shaded blue area).
### Interpretation
The data strongly suggests that the "Prototypical" approach is superior to the "Frozen" approach for incremental learning tasks. The "Frozen" models, which likely utilize a fixed feature extractor, fail to adapt to the distribution shifts inherent in adding new classes, leading to a rapid collapse in accuracy.
Conversely, the "Prototypical" models maintain a much higher degree of knowledge retention (as seen in the "All Classes" chart) and consistent performance on new data (as seen in the "New Classes" chart). The M5 ANN architecture appears to be more robust or better suited for this specific task than the SNN architecture, consistently yielding higher accuracy across all metrics. This visualization effectively demonstrates the trade-off between model rigidity ("Frozen") and adaptability ("Prototypical").