## Line Chart: Performance Comparison of Neural Networks
### Overview
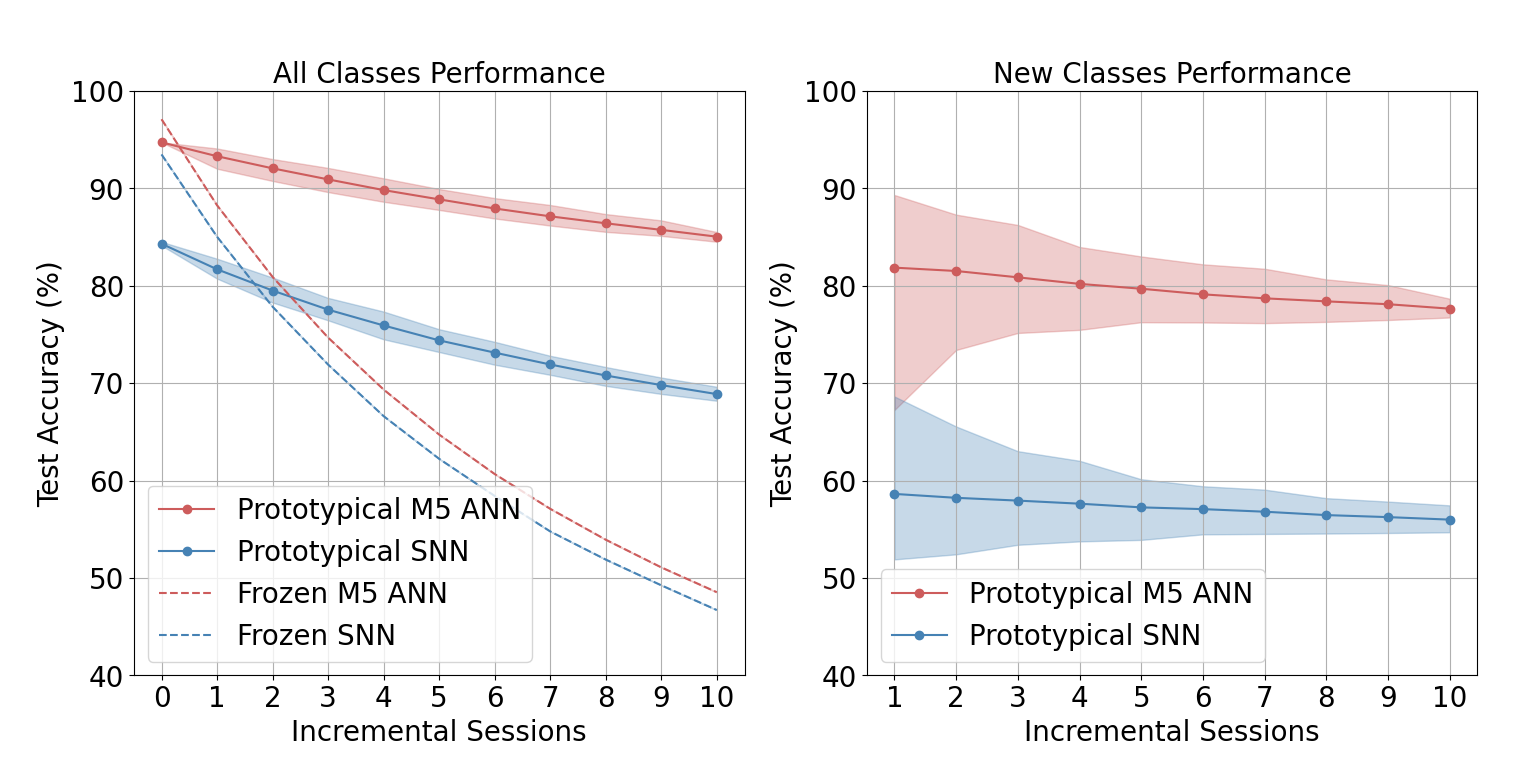
The image presents two line charts comparing the performance of different neural network configurations (ANN and SNN) under two scenarios: "All Classes Performance" and "New Classes Performance". The performance metric is "Test Accuracy (%)" plotted against "Incremental Sessions". The charts aim to illustrate how the accuracy of each network type changes as it is exposed to more incremental learning sessions.
### Components/Axes
**Chart 1: All Classes Performance**
* **X-axis:** Incremental Sessions (ranging from 0 to 10, with markers at each integer value).
* **Y-axis:** Test Accuracy (%) (ranging from 40 to 100, with markers at 10-unit intervals).
* **Data Series:**
* Prototypical M5 ANN (Red solid line with circle markers)
* Prototypical SNN (Blue solid line with circle markers)
* Frozen M5 ANN (Red dashed line)
* Frozen SNN (Blue dashed line)
**Chart 2: New Classes Performance**
* **X-axis:** Incremental Sessions (ranging from 0 to 10, with markers at each integer value).
* **Y-axis:** Test Accuracy (%) (ranging from 40 to 100, with markers at 10-unit intervals).
* **Data Series:**
* Prototypical M5 ANN (Red solid line with circle markers)
* Prototypical SNN (Blue solid line with circle markers)
**Legend:** Located in the bottom-left corner of each chart, clearly labeling each data series with its corresponding color and line style.
### Detailed Analysis or Content Details
**Chart 1: All Classes Performance**
* **Prototypical M5 ANN:** Starts at approximately 95% accuracy at session 0. The line slopes downward, exhibiting a decreasing trend. At session 10, the accuracy is approximately 73%.
* **Prototypical SNN:** Starts at approximately 83% accuracy at session 0. The line also slopes downward, but less steeply than the ANN. At session 10, the accuracy is approximately 53%.
* **Frozen M5 ANN:** Starts at approximately 88% accuracy at session 0. The line slopes downward, with a similar rate to the Prototypical SNN. At session 10, the accuracy is approximately 65%.
* **Frozen SNN:** Starts at approximately 78% accuracy at session 0. The line slopes downward, with a similar rate to the Prototypical SNN. At session 10, the accuracy is approximately 50%.
**Chart 2: New Classes Performance**
* **Prototypical M5 ANN:** Starts at approximately 92% accuracy at session 0. The line remains relatively stable, with a slight downward trend. At session 10, the accuracy is approximately 80%.
* **Prototypical SNN:** Starts at approximately 63% accuracy at session 0. The line remains relatively stable, with a slight upward trend. At session 10, the accuracy is approximately 60%.
### Key Observations
* In the "All Classes Performance" chart, the Prototypical M5 ANN consistently outperforms the Prototypical SNN, and both frozen models perform worse than their prototypical counterparts.
* The "New Classes Performance" chart shows that the Prototypical M5 ANN maintains a high level of accuracy, while the Prototypical SNN shows minimal improvement over the 10 sessions.
* The accuracy of the Prototypical M5 ANN decreases more rapidly in the "All Classes Performance" chart compared to the "New Classes Performance" chart.
* The Frozen models show a more consistent decline in accuracy across all sessions in the "All Classes Performance" chart.
### Interpretation
The data suggests that the Prototypical M5 ANN is more effective at learning and retaining information across incremental sessions, especially when considering all classes. The "New Classes Performance" chart indicates that the ANN is better at generalizing to new data, while the SNN struggles to improve its performance with additional sessions. The decline in accuracy for both networks in the "All Classes Performance" chart could be attributed to catastrophic forgetting, where learning new information overwrites previously learned knowledge. The frozen models demonstrate the importance of continued learning, as their performance degrades more significantly than the prototypical models. The difference in performance between the two charts highlights the impact of the learning scenario on the effectiveness of each network type. The ANN appears to be more robust to incremental learning, while the SNN may require different learning strategies to avoid performance degradation.