## Line Charts: Incremental Learning Performance Comparison
### Overview
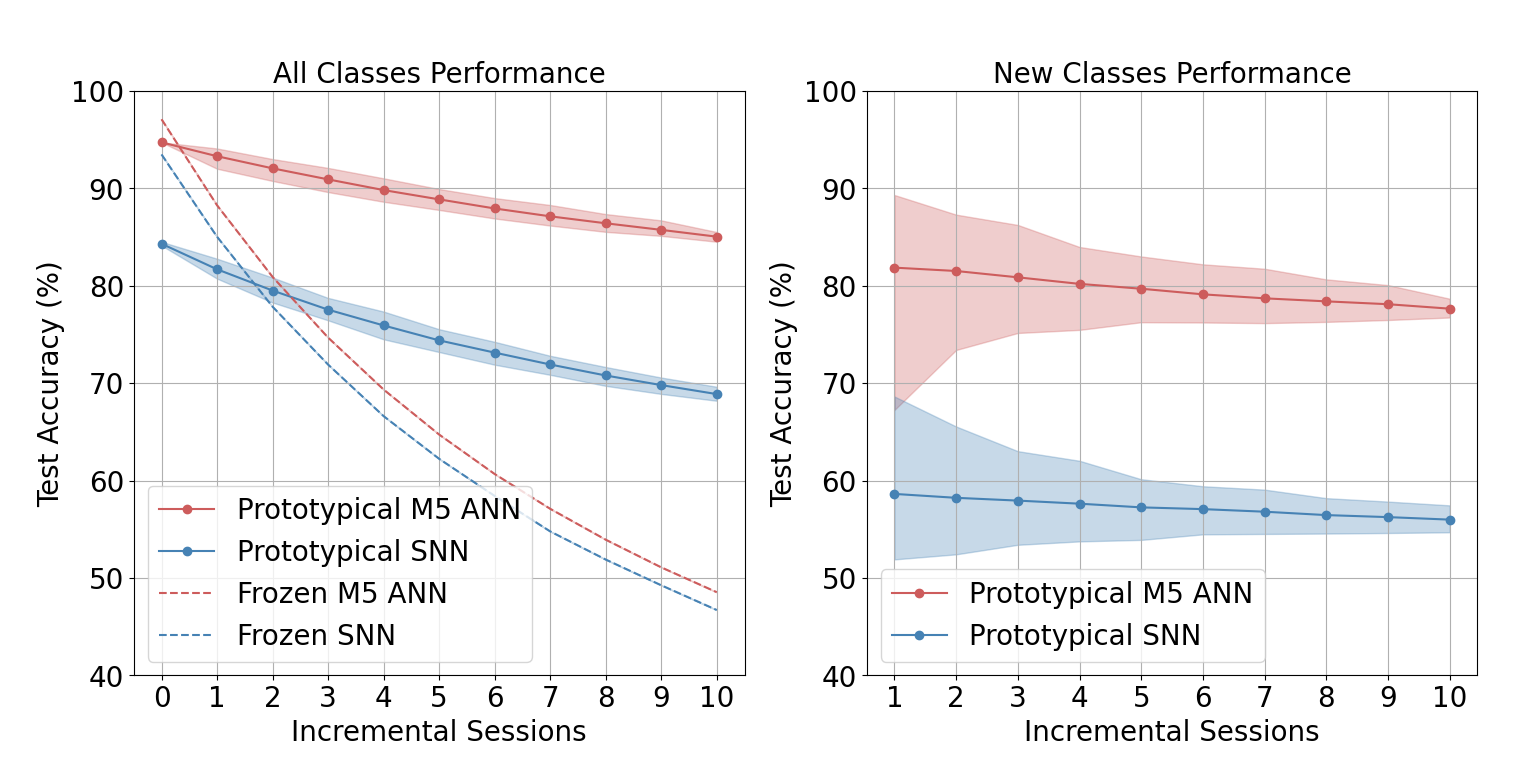
The image displays two side-by-side line charts comparing the test accuracy of different neural network models over a series of incremental learning sessions. The left chart evaluates performance on "All Classes," while the right chart focuses specifically on "New Classes." Both charts track accuracy from session 0 or 1 through session 10.
### Components/Axes
**Common Elements (Both Charts):**
* **X-Axis:** Labeled "Incremental Sessions." The left chart ranges from 0 to 10. The right chart ranges from 1 to 10.
* **Y-Axis:** Labeled "Test Accuracy (%)." The scale runs from 40 to 100 in increments of 10.
* **Grid:** A light gray grid is present in the background of both plots.
* **Legend Placement:** The legend is located in the bottom-left corner of each chart's plotting area.
**Left Chart: "All Classes Performance"**
* **Title:** "All Classes Performance" (centered at the top).
* **Legend (Bottom-Left):**
* Red solid line with circle markers: `Prototypical M5 ANN`
* Blue solid line with circle markers: `Prototypical SNN`
* Red dashed line: `Frozen M5 ANN`
* Blue dashed line: `Frozen SNN`
* **Data Series:** Four lines are plotted, each with a shaded region representing confidence intervals or variance.
**Right Chart: "New Classes Performance"**
* **Title:** "New Classes Performance" (centered at the top).
* **Legend (Bottom-Left):**
* Red solid line with circle markers: `Prototypical M5 ANN`
* Blue solid line with circle markers: `Prototypical SNN`
* **Data Series:** Two lines are plotted, each with a shaded region representing confidence intervals or variance.
### Detailed Analysis
**Left Chart: All Classes Performance**
* **Trend Verification:** All four lines show a downward trend as incremental sessions increase. The "Frozen" models (dashed lines) degrade much more rapidly than the "Prototypical" models (solid lines).
* **Data Points (Approximate):**
* **Prototypical M5 ANN (Red Solid):** Starts at ~95% (Session 0). Declines steadily and linearly to ~85% (Session 10). The shaded confidence band is relatively narrow.
* **Prototypical SNN (Blue Solid):** Starts at ~84% (Session 0). Declines steadily to ~69% (Session 10). The shaded band is slightly wider than for the M5 ANN.
* **Frozen M5 ANN (Red Dashed):** Starts at ~97% (Session 0). Declines sharply, crossing below the Prototypical SNN line around Session 2. Ends at ~49% (Session 10).
* **Frozen SNN (Blue Dashed):** Starts at ~94% (Session 0). Declines sharply, following a path very close to but slightly below the Frozen M5 ANN line. Ends at ~47% (Session 10).
**Right Chart: New Classes Performance**
* **Trend Verification:** Both lines show a very gradual downward trend. The confidence intervals (shaded regions) are notably wider than in the left chart, especially for the Prototypical M5 ANN at early sessions.
* **Data Points (Approximate):**
* **Prototypical M5 ANN (Red Solid):** Starts at ~82% (Session 1). Declines very slowly to ~78% (Session 10). The shaded confidence band is very wide at Session 1 (spanning ~68% to ~89%) and narrows considerably by Session 10.
* **Prototypical SNN (Blue Solid):** Starts at ~59% (Session 1). Declines very slowly to ~56% (Session 10). The shaded confidence band is moderately wide and remains relatively consistent across sessions.
### Key Observations
1. **Prototypical vs. Frozen:** The "Prototypical" learning methods (solid lines) demonstrate significantly better resistance to catastrophic forgetting than the "Frozen" methods (dashed lines) when evaluating all classes. The frozen models' accuracy plummets after the first few sessions.
2. **M5 ANN vs. SNN:** The M5 ANN architecture consistently outperforms the SNN architecture in both prototypical and frozen configurations on the "All Classes" task. On the "New Classes" task, the M5 ANN also maintains a substantial accuracy lead over the SNN.
3. **Performance on New Classes:** Accuracy on newly introduced classes is lower than on the full set of all classes for both model types. The Prototypical M5 ANN maintains a respectable ~78% accuracy on new classes after 10 sessions, while the Prototypical SNN hovers in the mid-50s.
4. **Uncertainty/Variance:** The confidence intervals for the "New Classes" performance are much wider, particularly for the M5 ANN in early sessions. This suggests higher variance or less certainty in the model's performance on novel data immediately after it is introduced.
### Interpretation
The data strongly suggests that the "Prototypical" learning approach is far more effective for continual learning in this context than simply using "Frozen" (likely pre-trained and non-adapting) features. The frozen models suffer from severe catastrophic forgetting, losing nearly half their initial accuracy by session 10.
The M5 ANN architecture appears to be more robust and capable than the SNN architecture for this task, maintaining higher accuracy across all conditions. However, both architectures experience a performance drop when evaluated solely on new, incrementally added classes, highlighting the inherent challenge of learning new information without interfering with or benefiting from prior knowledge.
The wide confidence intervals for new class performance indicate that the models' ability to generalize to novel data is less stable and predictable than their performance on the aggregate of all seen classes. This could be due to factors like the similarity of new classes to old ones or the amount of data available per session. The narrowing of the confidence interval for the M5 ANN over time suggests it becomes more stable in its new-class performance as it accumulates more incremental sessions.