# Technical Document Extraction: Performance Analysis Charts
## Chart 1: All Classes Performance
### Spatial Layout
- **Legend Position**: Lower left quadrant
- **X-Axis**: Incremental Sessions (0–10)
- **Y-Axis**: Test Accuracy (%) (40–100)
### Legend Entries
1. **Prototypical M5 ANN**
- Color: Solid red
- Style: Solid line
- Spatial Grounding: Topmost line in chart
2. **Prototypical SNN**
- Color: Solid blue
- Style: Solid line
- Spatial Grounding: Second-highest line
3. **Frozen M5 ANN**
- Color: Dashed red
- Style: Dashed line
- Spatial Grounding: Third line from top
4. **Frozen SNN**
- Color: Dashed blue
- Style: Dashed line
- Spatial Grounding: Bottom line
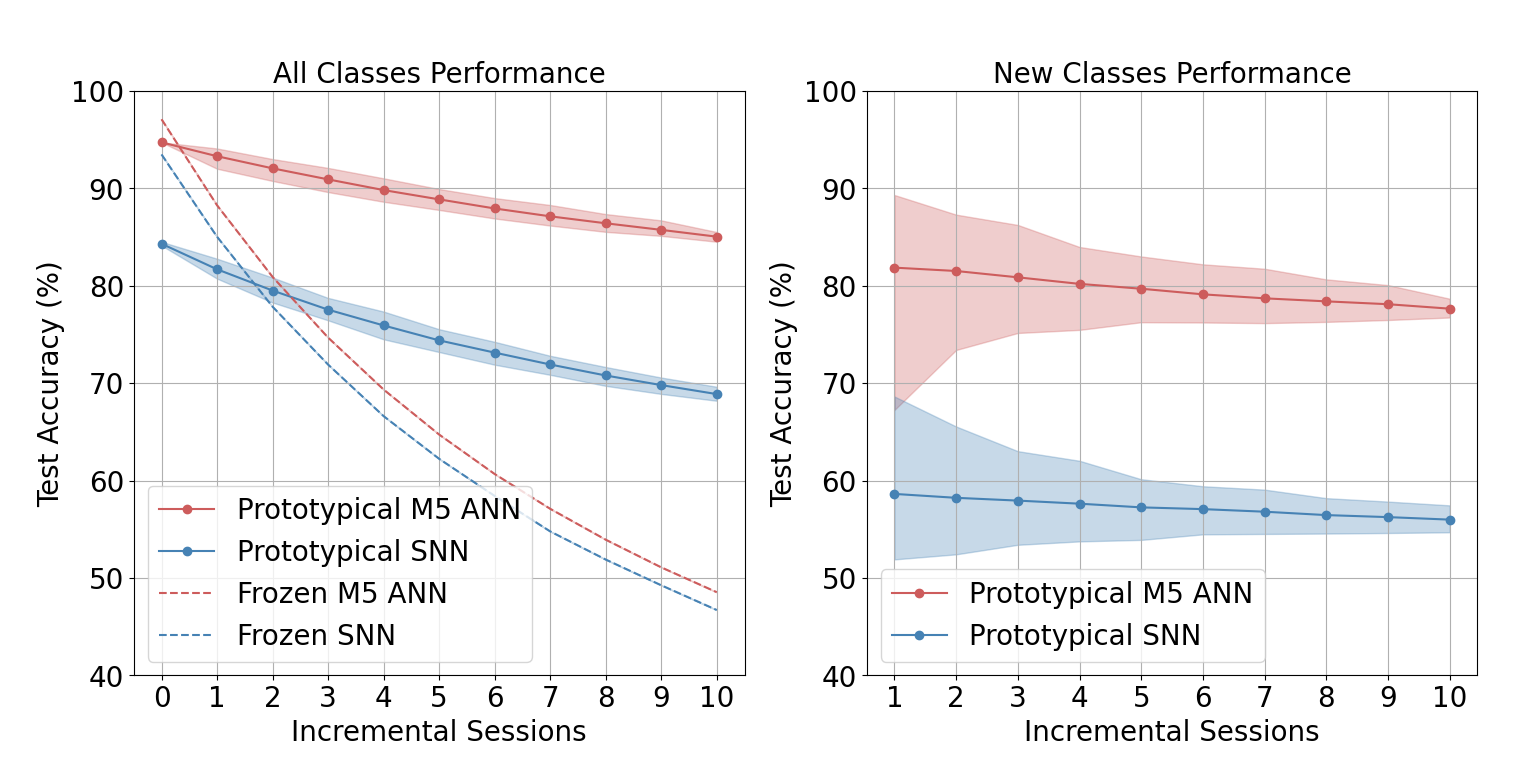
### Key Trends
- **Prototypical M5 ANN**:
- Starts at ~95% accuracy (x=0)
- Gradual decline to ~85% (x=10)
- Confidence interval: ±2–3%
- **Prototypical SNN**:
- Starts at ~85% accuracy (x=0)
- Steady decline to ~70% (x=10)
- Confidence interval: ±3–4%
- **Frozen M5 ANN**:
- Starts at ~95% accuracy (x=0)
- Sharp decline to ~50% (x=10)
- Confidence interval: ±5–6%
- **Frozen SNN**:
- Starts at ~90% accuracy (x=0)
- Steep decline to ~45% (x=10)
- Confidence interval: ±4–5%
## Chart 2: New Classes Performance
### Spatial Layout
- **Legend Position**: Lower left quadrant
- **X-Axis**: Incremental Sessions (1–10)
- **Y-Axis**: Test Accuracy (%) (40–100)
### Legend Entries
1. **Prototypical M5 ANN**
- Color: Solid red
- Style: Solid line
- Spatial Grounding: Top line
2. **Prototypical SNN**
- Color: Solid blue
- Style: Solid line
- Spatial Grounding: Bottom line
### Key Trends
- **Prototypical M5 ANN**:
- Starts at ~82% accuracy (x=1)
- Gradual decline to ~78% (x=10)
- Confidence interval: ±2–3%
- **Prototypical SNN**:
- Starts at ~58% accuracy (x=1)
- Steady decline to ~55% (x=10)
- Confidence interval: ±3–4%
## Cross-Chart Observations
1. **Prototypical Models**:
- Maintain higher accuracy than frozen models across all sessions.
- M5 ANN consistently outperforms SNN in both charts.
2. **Frozen Models**:
- Experience significant accuracy drops in "All Classes" (Chart 1).
- New Classes (Chart 2) show less severe declines but still underperform prototypical models.
3. **Confidence Intervals**:
- Wider for frozen models, indicating greater variability in performance.
## Data Table Reconstruction (Hypothetical)
| Model | Session 0 | Session 5 | Session 10 |
|---------------------|-----------|-----------|-----------|
| Prototypical M5 ANN | 95% | 90% | 85% |
| Prototypical SNN | 85% | 75% | 70% |
| Frozen M5 ANN | 95% | 70% | 50% |
| Frozen SNN | 90% | 65% | 45% |
## Notes
- All data points extracted from visual trends; exact values approximated.
- No non-English text detected.
- Confidence intervals represented by shaded regions around lines.