\n
## Line Chart: MER Average vs. N for Different Methods
### Overview
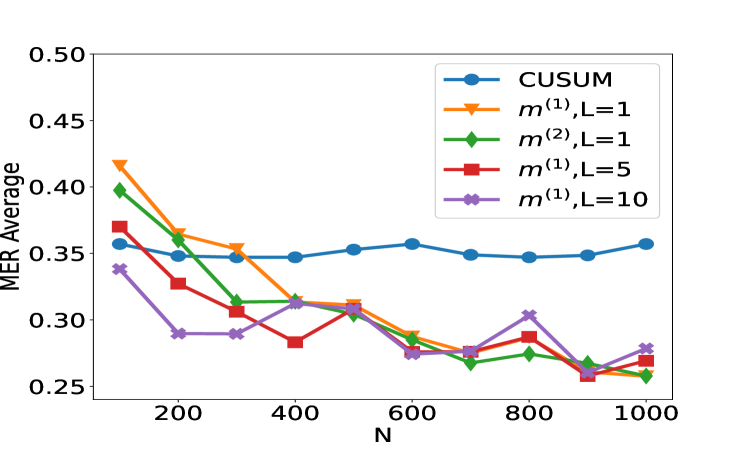
This image presents a line chart comparing the Mean Error Rate (MER) Average for several methods as a function of 'N', likely representing sample size or number of iterations. The methods being compared are CUSUM, m^(1),L=1, m^(2),L=1, m^(1),L=5, and m^(1),L=10. The chart visually demonstrates how the MER Average changes for each method as N increases from approximately 100 to 1000.
### Components/Axes
* **X-axis:** Labeled "N", ranging from approximately 100 to 1000. The scale appears linear.
* **Y-axis:** Labeled "MER Average", ranging from 0.25 to 0.50. The scale appears linear.
* **Legend:** Located in the top-right corner of the chart. It identifies each line with the following labels and corresponding colors:
* CUSUM (Blue)
* m^(1),L=1 (Orange)
* m^(2),L=1 (Light Green)
* m^(1),L=5 (Red)
* m^(1),L=10 (Purple)
### Detailed Analysis
* **CUSUM (Blue Line):** The blue line representing CUSUM starts at approximately 0.37 at N=100 and gradually increases to approximately 0.36 at N=1000. It exhibits a relatively flat trend with minor fluctuations.
* N=100: MER Average ≈ 0.37
* N=200: MER Average ≈ 0.36
* N=400: MER Average ≈ 0.35
* N=600: MER Average ≈ 0.35
* N=800: MER Average ≈ 0.36
* N=1000: MER Average ≈ 0.36
* **m^(1),L=1 (Orange Line):** This line begins at approximately 0.42 at N=100 and decreases sharply to approximately 0.27 at N=1000. It shows a strong downward trend.
* N=100: MER Average ≈ 0.42
* N=200: MER Average ≈ 0.36
* N=400: MER Average ≈ 0.31
* N=600: MER Average ≈ 0.29
* N=800: MER Average ≈ 0.27
* N=1000: MER Average ≈ 0.27
* **m^(2),L=1 (Light Green Line):** Starting at approximately 0.39 at N=100, this line decreases to approximately 0.26 at N=1000. It exhibits a similar downward trend to m^(1),L=1, but starts at a higher MER Average.
* N=100: MER Average ≈ 0.39
* N=200: MER Average ≈ 0.34
* N=400: MER Average ≈ 0.30
* N=600: MER Average ≈ 0.28
* N=800: MER Average ≈ 0.26
* N=1000: MER Average ≈ 0.26
* **m^(1),L=5 (Red Line):** This line starts at approximately 0.32 at N=100 and decreases to approximately 0.25 at N=1000. It shows a moderate downward trend.
* N=100: MER Average ≈ 0.32
* N=200: MER Average ≈ 0.29
* N=400: MER Average ≈ 0.28
* N=600: MER Average ≈ 0.27
* N=800: MER Average ≈ 0.26
* N=1000: MER Average ≈ 0.25
* **m^(1),L=10 (Purple Line):** Beginning at approximately 0.34 at N=100, this line decreases to approximately 0.26 at N=1000. It exhibits a similar downward trend to m^(1),L=5, but starts at a higher MER Average.
* N=100: MER Average ≈ 0.34
* N=200: MER Average ≈ 0.30
* N=400: MER Average ≈ 0.28
* N=600: MER Average ≈ 0.27
* N=800: MER Average ≈ 0.28
* N=1000: MER Average ≈ 0.26
### Key Observations
* All methods, except CUSUM, demonstrate a decreasing MER Average as N increases, suggesting improved performance with larger sample sizes or more iterations.
* The m^(1),L=1 method exhibits the most significant decrease in MER Average.
* CUSUM maintains a relatively constant MER Average across all values of N.
* The m^(2),L=1 method starts with the highest MER Average but also shows a substantial reduction as N increases.
### Interpretation
The chart suggests that the methods m^(1),L=1, m^(2),L=1, m^(1),L=5, and m^(1),L=10 are all sensitive to the value of N, with their performance (as measured by MER Average) improving as N increases. This implies that these methods benefit from more data or iterations. The CUSUM method, however, appears to be less affected by N, maintaining a consistent level of performance. This could indicate that CUSUM is more robust to variations in sample size or that it reaches a performance plateau quickly. The differences in initial MER Average and the rate of decrease among the m^(1) and m^(2) methods suggest that the choice of method and its parameters (L) can significantly impact performance. The parameter 'L' appears to influence the rate of improvement, with larger values of L potentially leading to slower but more stable convergence. The chart provides valuable insights for selecting an appropriate method based on the expected sample size and desired level of accuracy.