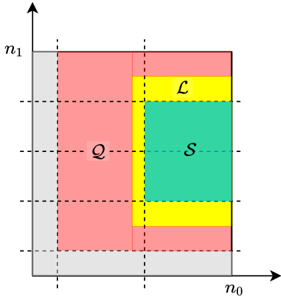
## Diagram: Partitioned Grid with Colored Regions
### Overview
The image depicts a two-dimensional grid partitioned into three distinct colored regions labeled **Q** (pink), **S** (teal), and **L** (yellow). The grid is bounded by axes labeled **n₀** (horizontal) and **n₁** (vertical), with dashed lines demarcating the boundaries of each region. The legend is positioned on the right side of the diagram.
---
### Components/Axes
- **Axes**:
- **x-axis (n₀)**: Horizontal axis, labeled with no explicit scale but divided into segments by dashed lines at approximate positions **n₀ = 0.3** and **n₀ = 0.7**.
- **y-axis (n₁)**: Vertical axis, labeled with no explicit scale but divided into segments by dashed lines at approximate positions **n₁ = 0.3** and **n₁ = 0.7**.
- **Legend**:
- **Q**: Pink, located in the top-left quadrant.
- **S**: Teal, located in the bottom-right quadrant.
- **L**: Yellow, forming a vertical strip in the center.
---
### Detailed Analysis
1. **Region Q (Pink)**:
- Positioned in the **top-left quadrant**.
- Bounded by:
- **n₀**: 0 to ~0.3
- **n₁**: ~0.7 to 1
- Shape: Rectangular.
2. **Region S (Teal)**:
- Positioned in the **bottom-right quadrant**.
- Bounded by:
- **n₀**: ~0.7 to 1
- **n₁**: ~0.3 to 0.7
- Shape: Rectangular.
3. **Region L (Yellow)**:
- Forms a **vertical strip** spanning the entire **n₁** axis.
- Bounded by:
- **n₀**: ~0.3 to 0.7
- Shape: Rectangular, acting as a separator between Q and S.
4. **Dashed Lines**:
- Vertical dashed lines at **n₀ = 0.3** and **n₀ = 0.7**.
- Horizontal dashed lines at **n₁ = 0.3** and **n₁ = 0.7**.
- These lines define the boundaries of all regions.
---
### Key Observations
- The regions **Q**, **S**, and **L** are non-overlapping and collectively cover the entire grid.
- **L** acts as a central divider, separating **Q** (top-left) and **S** (bottom-right).
- The grid’s symmetry suggests a deliberate partitioning, possibly representing decision boundaries or classification zones.
---
### Interpretation
This diagram likely represents a **classification or decision boundary** in a two-dimensional parameter space (**n₀**, **n₁**). The regions **Q** and **S** could denote distinct classes or states, while **L** might represent a threshold or transitional zone. The use of dashed lines implies discrete boundaries, suggesting a model where inputs fall unambiguously into one of the three categories. The absence of numerical data or gradients indicates a categorical rather than continuous relationship between **n₀**, **n₁**, and the regions. The spatial grounding of **L** as a central separator highlights its potential role as a critical boundary in the system being modeled.