\n
## Chart: Performance Comparison of MCQs and OSQs Across Datasets
### Overview
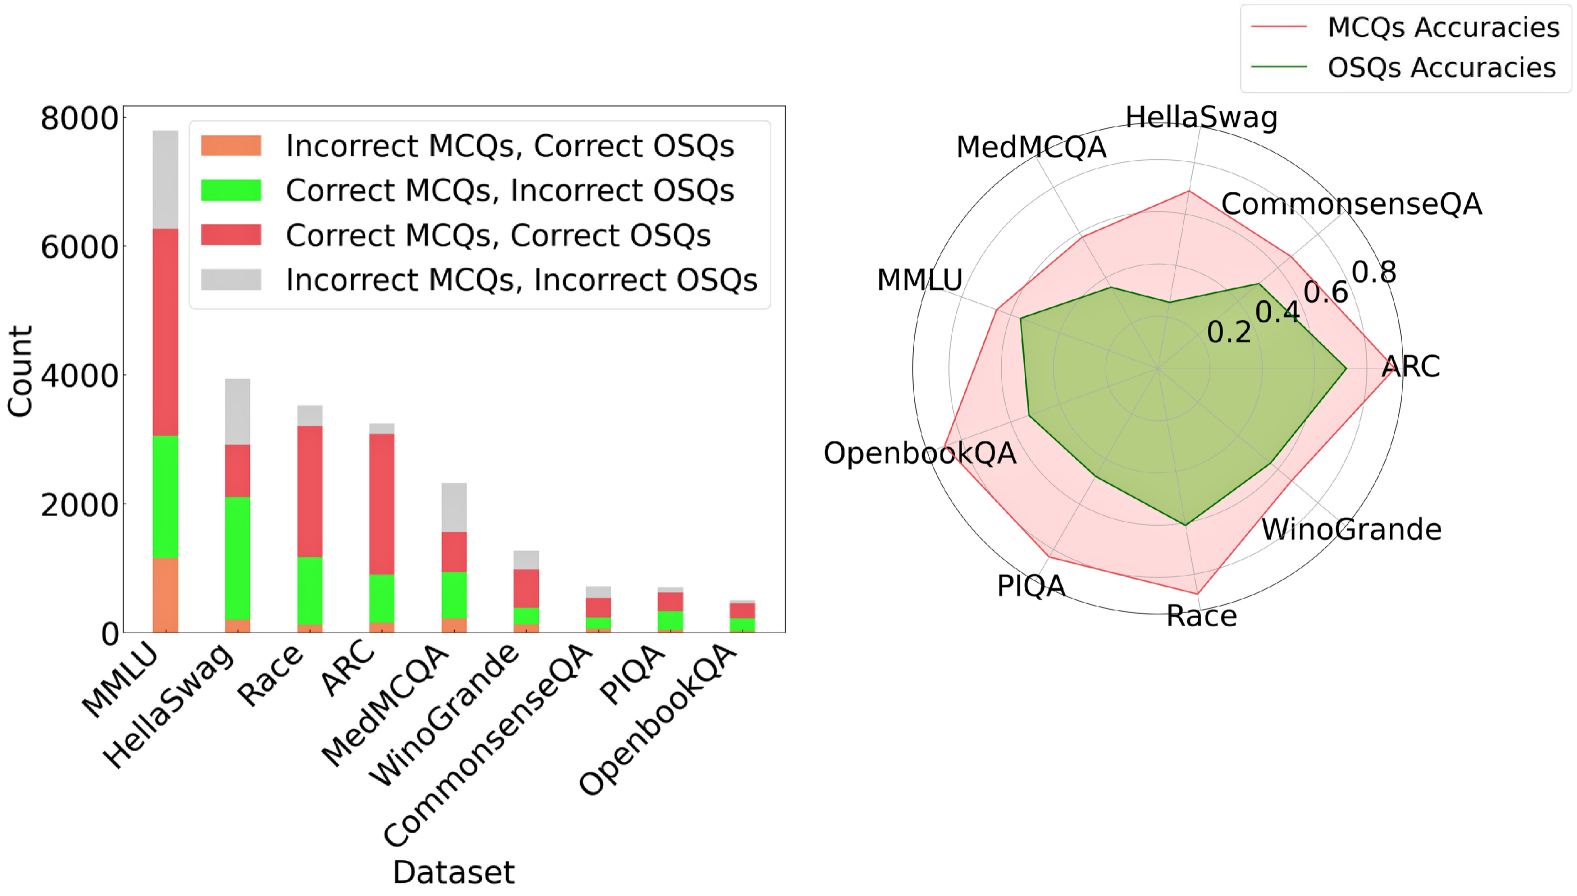
This chart presents a comparative analysis of performance on Multiple Choice Questions (MCQs) and Open-ended Short Questions (OSQs) across various datasets. The left side is a bar chart showing the count of correct and incorrect answers for each question type, while the right side is a radar chart displaying accuracy scores.
### Components/Axes
* **Left Chart:**
* X-axis: Dataset (MMLU, HellaSwag, Race, ARC, MedMCQA, Winogrande, CommonsenseQA, PIQA, OpenbookQA)
* Y-axis: Count (ranging from 0 to 8000)
* Bar Colors:
* Red: Incorrect MCQs, Correct OSQs
* Green: Correct MCQs, Incorrect OSQs
* Blue: Incorrect MCQs, Incorrect OSQs
* **Right Chart:**
* Radial Axes: Representing the datasets (MMLU, HellaSwag, CommonsenseQA, ARC, OpenbookQA, PIQA, Race, Winogrande, MedMCQA)
* Radial Scale: Accuracy (ranging from 0 to 1.0)
* Line Colors:
* Red: MCQs Accuracies
* Pink: OSQs Accuracies
* **Legend (Top-Right):** Clearly identifies the line colors for MCQs and OSQs accuracies.
### Detailed Analysis or Content Details
**Left Chart (Bar Chart):**
* **MMLU:** Approximately 6500 Incorrect MCQs, Correct OSQs; ~500 Correct MCQs, Incorrect OSQs; ~500 Incorrect MCQs, Incorrect OSQs.
* **HellaSwag:** Approximately 5500 Incorrect MCQs, Correct OSQs; ~1000 Correct MCQs, Incorrect OSQs; ~500 Incorrect MCQs, Incorrect OSQs.
* **Race:** Approximately 2500 Incorrect MCQs, Correct OSQs; ~2500 Correct MCQs, Incorrect OSQs; ~500 Incorrect MCQs, Incorrect OSQs.
* **ARC:** Approximately 2000 Incorrect MCQs, Correct OSQs; ~2000 Correct MCQs, Incorrect OSQs; ~500 Incorrect MCQs, Incorrect OSQs.
* **MedMCQA:** Approximately 1000 Incorrect MCQs, Correct OSQs; ~1000 Correct MCQs, Incorrect OSQs; ~200 Incorrect MCQs, Incorrect OSQs.
* **Winogrande:** Approximately 800 Incorrect MCQs, Correct OSQs; ~500 Correct MCQs, Incorrect OSQs; ~200 Incorrect MCQs, Incorrect OSQs.
* **CommonsenseQA:** Approximately 600 Incorrect MCQs, Correct OSQs; ~400 Correct MCQs, Incorrect OSQs; ~100 Incorrect MCQs, Incorrect OSQs.
* **PIQA:** Approximately 400 Incorrect MCQs, Correct OSQs; ~200 Correct MCQs, Incorrect OSQs; ~50 Incorrect MCQs, Incorrect OSQs.
* **OpenbookQA:** Approximately 300 Incorrect MCQs, Correct OSQs; ~200 Correct MCQs, Incorrect OSQs; ~50 Incorrect MCQs, Incorrect OSQs.
**Right Chart (Radar Chart):**
* **MMLU:** MCQs Accuracy ~0.8, OSQs Accuracy ~0.2
* **HellaSwag:** MCQs Accuracy ~0.8, OSQs Accuracy ~0.2
* **CommonsenseQA:** MCQs Accuracy ~0.6, OSQs Accuracy ~0.4
* **ARC:** MCQs Accuracy ~0.6, OSQs Accuracy ~0.4
* **OpenbookQA:** MCQs Accuracy ~0.4, OSQs Accuracy ~0.6
* **PIQA:** MCQs Accuracy ~0.4, OSQs Accuracy ~0.6
* **Race:** MCQs Accuracy ~0.4, OSQs Accuracy ~0.6
* **Winogrande:** MCQs Accuracy ~0.4, OSQs Accuracy ~0.6
* **MedMCQA:** MCQs Accuracy ~0.4, OSQs Accuracy ~0.6
### Key Observations
* The bar chart shows that across all datasets, there are significantly more instances of incorrect MCQs being answered correctly as OSQs than vice versa.
* The radar chart reveals that MCQs generally achieve higher accuracy scores than OSQs on MMLU and HellaSwag.
* On datasets like OpenbookQA, PIQA, Race, Winogrande, and MedMCQA, OSQs consistently outperform MCQs in terms of accuracy.
* The accuracy scores for MCQs and OSQs are relatively similar on CommonsenseQA and ARC.
### Interpretation
The data suggests a trade-off between question type and dataset complexity. MCQs excel on datasets requiring factual recall or pattern recognition (MMLU, HellaSwag), where the multiple-choice format can guide the answer. However, OSQs demonstrate superior performance on datasets demanding reasoning, common sense, or nuanced understanding (OpenbookQA, PIQA, Race, Winogrande, MedMCQA). This indicates that OSQs are better suited for evaluating higher-order cognitive skills.
The large number of incorrect MCQs answered correctly as OSQs suggests that many questions may be ambiguous or poorly designed, leading to incorrect selections in the MCQ format but eliciting correct responses when open-ended. The radar chart visually reinforces this, showing a clear divergence in performance based on the dataset. The datasets where OSQs outperform MCQs are likely those where the nuances of language and context are critical for accurate answers, something that OSQs can better capture. The positioning of the datasets on the radar chart also suggests a clustering of performance, with some datasets consistently favoring one question type over the other.