## Bar Chart: Dataset Performance Breakdown by Question Type
### Overview
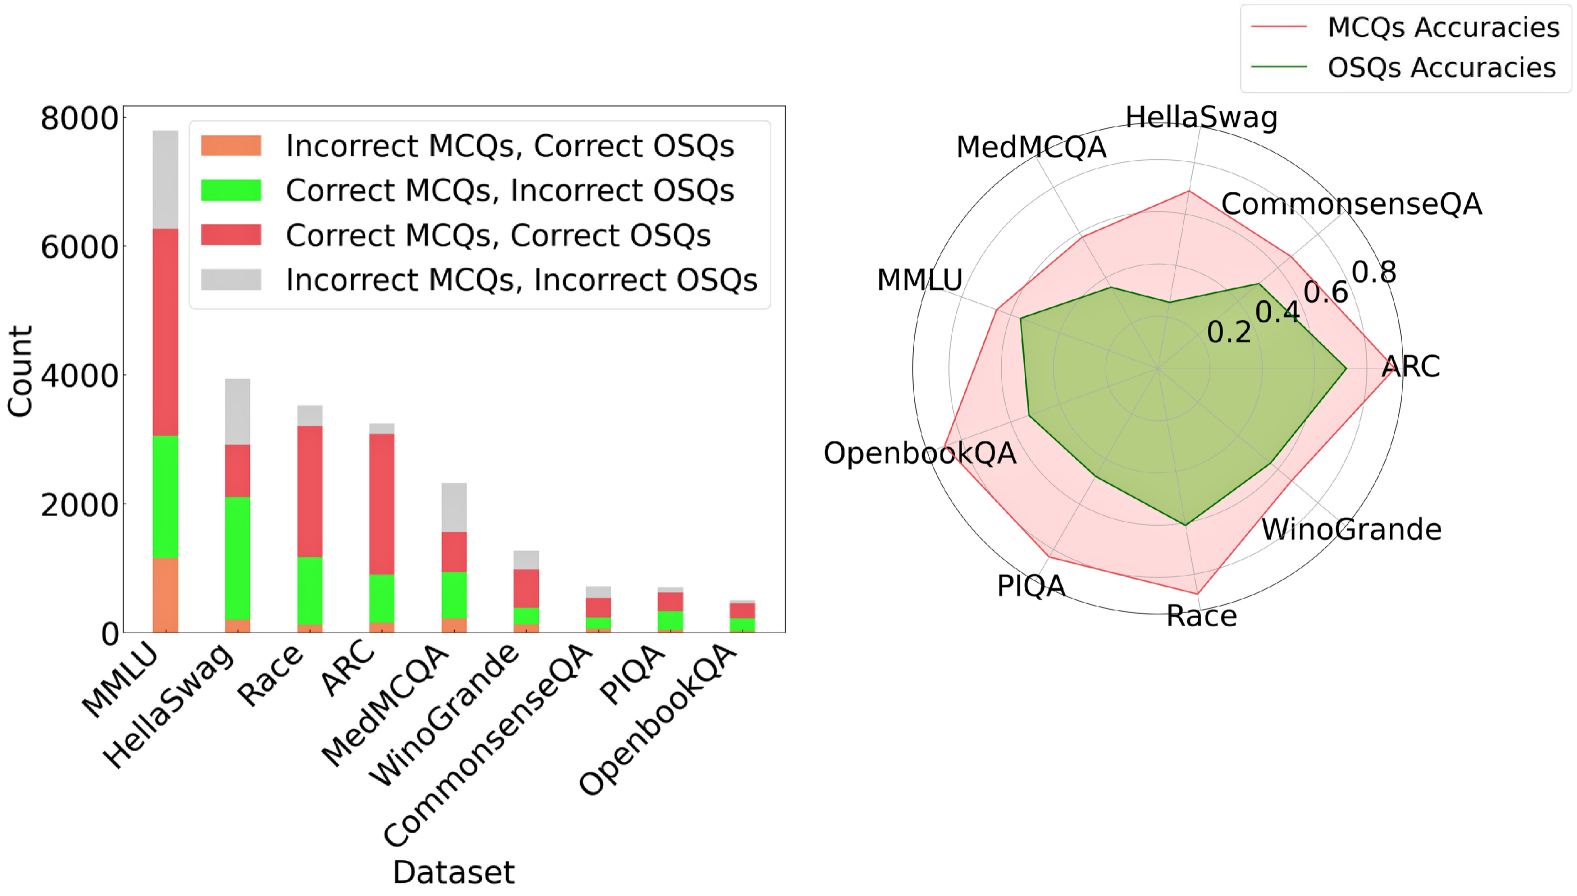
The bar chart compares performance metrics across multiple datasets, segmented by question type (MCQs/OSQs) and correctness. Each bar is divided into four color-coded segments representing combinations of correct/incorrect answers for MCQs and OSQs.
### Components/Axes
- **X-axis (Datasets)**:
- MMLU, HellaSwag, Race, ARC, MedMCQA, WinoGrande, CommonsenseQA, PIQA, OpenbookQA
- **Y-axis (Count)**:
- Scale from 0 to 8,000 in increments of 2,000
- **Legend**:
- Orange: Incorrect MCQs, Correct OSQs
- Green: Correct MCQs, Incorrect OSQs
- Red: Correct MCQs, Correct OSQs
- Gray: Incorrect MCQs, Incorrect OSQs
### Detailed Analysis
- **MMLU**:
- Tallest bar (~8,000 total)
- Segments: ~1,000 (orange), ~2,000 (green), ~6,000 (red), ~1,000 (gray)
- **HellaSwag**:
- ~4,000 total
- Segments: ~200 (orange), ~1,800 (green), ~2,000 (red), ~1,000 (gray)
- **Race**:
- ~3,500 total
- Segments: ~100 (orange), ~1,200 (green), ~2,200 (red), ~100 (gray)
- **ARC**:
- ~3,200 total
- Segments: ~150 (orange), ~900 (green), ~2,150 (red), ~0 (gray)
- **MedMCQA**:
- ~2,500 total
- Segments: ~200 (orange), ~1,000 (green), ~1,300 (red), ~0 (gray)
- **WinoGrande**:
- ~1,500 total
- Segments: ~100 (orange), ~400 (green), ~1,000 (red), ~0 (gray)
- **CommonsenseQA**:
- ~800 total
- Segments: ~50 (orange), ~200 (green), ~500 (red), ~50 (gray)
- **PIQA**:
- ~600 total
- Segments: ~30 (orange), ~150 (green), ~400 (red), ~20 (gray)
- **OpenbookQA**:
- ~400 total
- Segments: ~20 (orange), ~100 (green), ~250 (red), ~30 (gray)
### Key Observations
1. **MCQ Dominance**: Correct MCQs (red) consistently dominate across all datasets, with MMLU showing the highest count (~6,000).
2. **OSQ Variability**: Correct OSQs (green) vary significantly, with MMLU having the highest (~2,000) and OpenbookQA the lowest (~100).
3. **Error Patterns**: Incorrect MCQs (orange) are minimal except in MMLU (~1,000). Incorrect OSQs (gray) are negligible in most datasets but present in MMLU and CommonsenseQA.
### Interpretation
The data suggests MCQs are more frequently answered correctly than OSQs across all datasets, with MMLU exhibiting the largest volume of correct MCQs. The near-absence of incorrect OSQs in datasets like ARC and MedMCQA implies higher reliability for OSQs in these contexts. However, the dominance of MCQs may reflect dataset design biases rather than inherent question type superiority.
## Radar Chart: MCQ vs. OSQ Accuracy Comparison
### Overview
The radar chart compares accuracy scores (0–0.8) for MCQs (red) and OSQs (green) across nine datasets. MCQ accuracies consistently outperform OSQs, with ARC showing the highest MCQ accuracy and CommonsenseQA the lowest.
### Components/Axes
- **Axes (Datasets)**:
- ARC, CommonsenseQA, PIQA, WinoGrande, OpenbookQA, Race, MedMCQA, HellaSwag, MMLU
- **Legend**:
- Red: MCQs Accuracies
- Green: OSQs Accuracies
### Detailed Analysis
- **ARC**:
- MCQs: ~0.75
- OSQs: ~0.5
- **CommonsenseQA**:
- MCQs: ~0.6
- OSQs: ~0.4
- **PIQA**:
- MCQs: ~0.65
- OSQs: ~0.45
- **WinoGrande**:
- MCQs: ~0.7
- OSQs: ~0.55
- **OpenbookQA**:
- MCQs: ~0.7
- OSQs: ~0.5
- **Race**:
- MCQs: ~0.68
- OSQs: ~0.48
- **MedMCQA**:
- MCQs: ~0.62
- OSQs: ~0.42
- **HellaSwag**:
- MCQs: ~0.6
- OSQs: ~0.4
- **MMLU**:
- MCQs: ~0.65
- OSQs: ~0.45
### Key Observations
1. **MCQ Superiority**: MCQ accuracies exceed OSQs by ~0.15–0.25 across all datasets.
2. **ARC Exception**: ARC shows the largest gap (~0.25) between MCQ and OSQ accuracies.
3. **CommonsenseQA**: Lowest performance for both question types, with MCQs at ~0.6 and OSQs at ~0.4.
### Interpretation
The radar chart reveals a systematic advantage for MCQs in accuracy, potentially due to structured answer choices simplifying response generation. However, the minimal OSQ accuracy in CommonsenseQA suggests challenges in open-ended reasoning for this dataset. The consistent MCQ-OSQ gap across datasets implies architectural or training biases favoring structured formats over open-ended ones.