## Bar Chart: Iteration Count by Category
### Overview
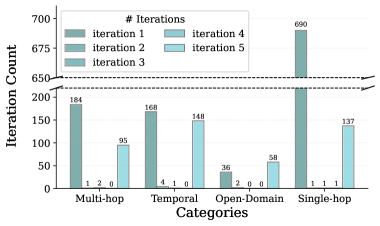
The image is a bar chart comparing the number of iterations required across four categories: Multi-hop, Temporal, Open-Domain, and Single-hop. The chart uses grouped bars to represent iteration counts for five distinct iterations (1, 2, 3, 4, 5), with a dashed horizontal line at 650 iterations serving as a threshold. The legend is positioned in the top-left corner, and the title is centered at the top of the chart.
---
### Components/Axes
- **X-axis (Categories)**: Labeled "Categories" with four groups:
- Multi-hop
- Temporal
- Open-Domain
- Single-hop
- **Y-axis (Iteration Count)**: Labeled "Iteration Count" with a scale from 0 to 700.
- **Legend**: Located in the top-left corner, mapping iteration numbers (1–5) to colors:
- Iteration 1: Dark teal
- Iteration 2: Medium teal
- Iteration 3: Light teal
- Iteration 4: Light blue
- Iteration 5: Light blue (same as Iteration 4)
- **Dashed Line**: A horizontal dashed line at 650 iterations, labeled as a threshold.
---
### Detailed Analysis
#### Multi-hop
- **Iteration 1**: 184 iterations (dark teal)
- **Iteration 2**: 168 iterations (medium teal)
- **Iteration 3**: 148 iterations (light teal)
- **Iteration 4**: 95 iterations (light blue)
- **Iteration 5**: 0 iterations (light blue)
#### Temporal
- **Iteration 1**: 4 iterations (dark teal)
- **Iteration 2**: 1 iteration (medium teal)
- **Iteration 3**: 0 iterations (light teal)
- **Iteration 4**: 0 iterations (light blue)
- **Iteration 5**: 1 iteration (light blue)
#### Open-Domain
- **Iteration 1**: 36 iterations (dark teal)
- **Iteration 2**: 2 iterations (medium teal)
- **Iteration 3**: 0 iterations (light teal)
- **Iteration 4**: 0 iterations (light blue)
- **Iteration 5**: 58 iterations (light blue)
#### Single-hop
- **Iteration 1**: 690 iterations (dark teal)
- **Iteration 2**: 1 iteration (medium teal)
- **Iteration 3**: 1 iteration (light teal)
- **Iteration 4**: 1 iteration (light blue)
- **Iteration 5**: 137 iterations (light blue)
---
### Key Observations
1. **Single-hop Dominance**: The Single-hop category has the highest iteration count (690) in Iteration 1, far exceeding the threshold of 650.
2. **Declining Trends**: Most categories show a decline in iteration counts across later iterations (e.g., Multi-hop drops from 184 to 95).
3. **Threshold Breach**: Only Single-hop in Iteration 1 exceeds the 650-iteration threshold.
4. **Low Activity in Later Iterations**: Open-Domain and Temporal categories have minimal or no activity in Iterations 2–4.
---
### Interpretation
The data suggests that **Single-hop** is the most resource-intensive category, requiring significantly more iterations than others, particularly in the first iteration. The threshold line at 650 likely represents a performance or efficiency benchmark, which only Single-hop in Iteration 1 surpasses. The decline in iteration counts for other categories (e.g., Multi-hop, Temporal) across later iterations may indicate optimization or reduced complexity in subsequent steps. Open-Domain’s sharp increase to 58 iterations in Iteration 5 suggests a late-stage adjustment or refinement phase. The absence of Iteration 3 data for most categories implies either no activity or a design choice to exclude it from the analysis.
The chart highlights a clear disparity in iteration demands between categories, with Single-hop standing out as the outlier. This could reflect differences in problem complexity, algorithmic requirements, or data processing strategies across categories.