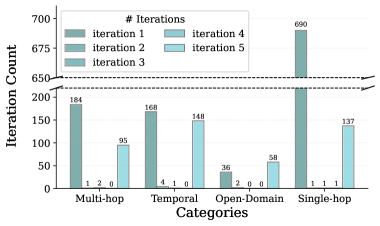
## Bar Chart: Iteration Count by Category and Iteration Number
### Overview
This image is a grouped bar chart illustrating the distribution of "Iteration Count" across four distinct "Categories" (Multi-hop, Temporal, Open-Domain, and Single-hop). The data is segmented into five sequential iterations, represented by different shades of teal and blue. A notable feature of this chart is a broken Y-axis to accommodate a significant outlier in the "Single-hop" category.
### Components/Axes
* **Y-Axis (Vertical):**
* **Label:** "Iteration Count" (positioned center-left).
* **Scale:** The axis starts at 0 and increments by 50 up to 200. There is a visual break (indicated by two parallel dashed lines with "zigzag" break symbols) between 200 and 650. The scale then resumes with increments of 25 (650, 675, 700).
* **X-Axis (Horizontal):**
* **Label:** "Categories" (positioned bottom-center).
* **Categories:** Multi-hop, Temporal, Open-Domain, Single-hop.
* **Legend:**
* **Title:** "# Iterations"
* **Position:** Top-left, inside the chart area.
* **Items:**
* **iteration 1:** Dark teal (leftmost bar in each group).
* **iteration 2:** Medium teal.
* **iteration 3:** Light teal.
* **iteration 4:** Light blue.
* **iteration 5:** Very light blue (rightmost bar in each group).
### Content Details
The following table reconstructs the data points displayed above each bar in the chart.
| Category | Iteration 1 | Iteration 2 | Iteration 3 | Iteration 4 | Iteration 5 |
| :--- | :---: | :---: | :---: | :---: | :---: |
| **Multi-hop** | 184 | 1 | 2 | 0 | 95 |
| **Temporal** | 168 | 4 | 1 | 0 | 148 |
| **Open-Domain** | 36 | 2 | 0 | 0 | 58 |
| **Single-hop** | 690 | 1 | 1 | 1 | 137 |
#### Visual Trend Verification:
* **Iteration 1 (Dark Teal):** Shows the highest count in three out of four categories. It exhibits a massive spike in the "Single-hop" category.
* **Iterations 2, 3, and 4:** These series consistently show near-zero values across all categories, appearing as flat lines or very tiny bars at the baseline.
* **Iteration 5 (Very Light Blue):** Shows a significant "rebound" or secondary peak in all categories. In the "Open-Domain" category, it is actually higher than Iteration 1.
### Key Observations
* **The "Single-hop" Outlier:** The Iteration 1 count for "Single-hop" (690) is more than triple the next highest value in that iteration (184 for Multi-hop). This necessitates the Y-axis break.
* **Bimodal Distribution:** Across all categories, there is a distinct "U-shaped" or bimodal pattern where Iteration 1 and Iteration 5 contain almost all the data, while the middle iterations (2-4) are nearly empty.
* **Open-Domain Exception:** This is the only category where the final iteration (58) exceeds the initial iteration (36).
### Interpretation
The data suggests a process—likely an algorithmic search, reasoning chain, or data processing pipeline—that typically resolves or reaches a state of interest either immediately (Iteration 1) or after a fixed number of steps (Iteration 5).
* **Efficiency/Directness:** The high values in Iteration 1 for "Single-hop" (690) compared to "Multi-hop" (184) suggest that the system is much more likely to find a result in a single step when the task is simple (single-hop).
* **The "Dead Zone":** The near-zero values for iterations 2, 3, and 4 indicate that if a result isn't found immediately, it is rarely found in the intermediate steps.
* **The "Final Effort":** The resurgence in Iteration 5 suggests a "fallback" mechanism or a concluding processing step that triggers after the intermediate steps fail to produce a result. In "Open-Domain" tasks, which are inherently broader and potentially more difficult, this final step is more productive than the initial attempt, suggesting that the complexity of the category requires more "thinking" or "hops" to resolve.