\n
## Bar Chart: Iteration Count by Category
### Overview
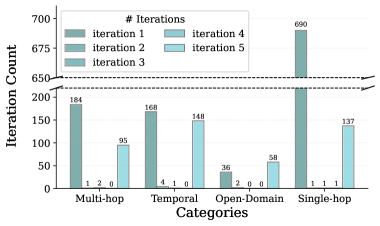
This is a bar chart visualizing the iteration count for different categories across five iterations. The chart compares the number of iterations performed for "Multi-hop", "Temporal", "Open-Domain", and "Single-hop" categories. The y-axis represents the iteration count, and the x-axis represents the categories. Each category has five bars, one for each iteration.
### Components/Axes
* **X-axis:** Categories - Multi-hop, Temporal, Open-Domain, Single-hop.
* **Y-axis:** Iteration Count - Scale ranges from 0 to 700, with increments of 50.
* **Legend:** Located in the top-right corner, indicating the color-coding for each iteration:
* Iteration 1: Dark Gray
* Iteration 2: Medium Gray
* Iteration 3: Light Gray
* Iteration 4: Light Blue
* Iteration 5: Pale Blue
* **Horizontal Lines:** Two horizontal dashed lines are present at approximately y = 650.
### Detailed Analysis
The chart consists of four groups of bars, one for each category. Within each group, there are five bars representing the iteration counts for iterations 1 through 5.
* **Multi-hop:**
* Iteration 1: Approximately 184
* Iteration 2: Approximately 1
* Iteration 3: Approximately 2
* Iteration 4: Approximately 0
* Iteration 5: Approximately 0
* **Temporal:**
* Iteration 1: Approximately 168
* Iteration 2: Approximately 95
* Iteration 3: Approximately 4
* Iteration 4: Approximately 1
* Iteration 5: Approximately 0
* **Open-Domain:**
* Iteration 1: Approximately 36
* Iteration 2: Approximately 2
* Iteration 3: Approximately 0
* Iteration 4: Approximately 0
* Iteration 5: Approximately 0
* **Single-hop:**
* Iteration 1: Approximately 690
* Iteration 2: Approximately 1
* Iteration 3: Approximately 1
* Iteration 4: Approximately 58
* Iteration 5: Approximately 137
The bars for Iteration 1 are significantly higher than those for subsequent iterations across all categories. The bars for Iterations 4 and 5 are generally low, except for Single-hop.
### Key Observations
* The "Single-hop" category has a dominant number of iterations in the first iteration (approximately 690), far exceeding any other category or iteration.
* Iteration 1 consistently shows the highest iteration counts across all categories.
* Iterations 2, 3, 4, and 5 show significantly lower iteration counts, suggesting a decrease in activity or a convergence of results after the first iteration.
* The "Open-Domain" category consistently has the lowest iteration counts across all iterations.
* The "Temporal" category shows a noticeable decrease in iteration count from Iteration 1 (168) to Iteration 2 (95), and then a sharp decline in subsequent iterations.
### Interpretation
The data suggests that the initial iteration (Iteration 1) requires the most effort or generates the most activity across all categories. This could be due to initial setup, data exploration, or the identification of initial issues. The subsequent decrease in iteration counts indicates that the process converges or stabilizes after the first iteration.
The "Single-hop" category's high iteration count in the first iteration, and its subsequent increase in Iterations 4 and 5, might indicate that this category is more complex or requires more refinement than the others. The "Open-Domain" category consistently having low iteration counts suggests it may be a simpler or less problematic area.
The horizontal lines at y=650 may represent a threshold or target value. The "Single-hop" category in Iteration 1 exceeds this threshold significantly, while other categories fall well below it. This could indicate that the "Single-hop" category is performing exceptionally well or requires further attention.