## Chart Type: Heatmap Grid of Attention Patterns
### Overview
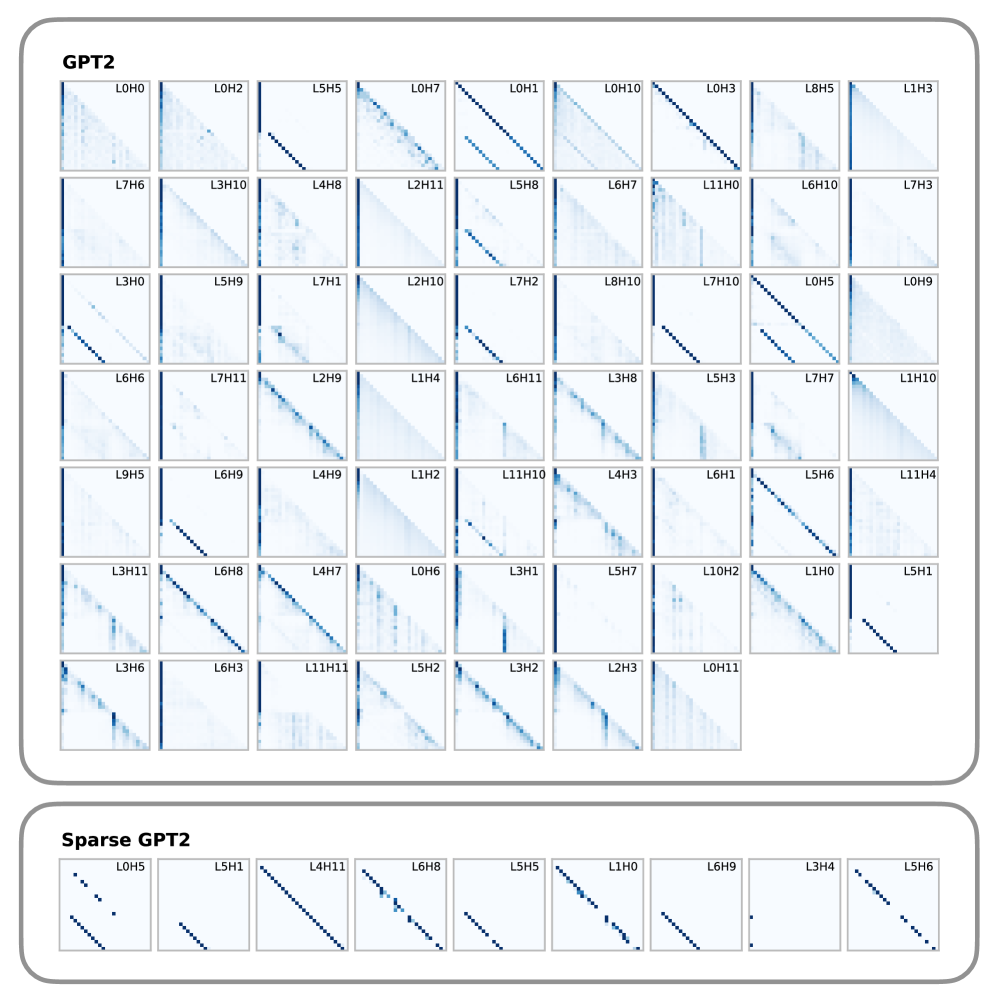
The image presents a grid of heatmaps, visualizing attention patterns within two different GPT2 models: a standard GPT2 model and a "Sparse GPT2" model. Each heatmap represents the attention pattern of a specific layer and head within the model. The heatmaps use color intensity to indicate the strength of attention between different parts of the input sequence. The standard GPT2 model's attention patterns are displayed in a 6x6 grid, while the Sparse GPT2 model's attention patterns are displayed in a single row of 8 heatmaps.
### Components/Axes
* **Titles:**
* Top Section: "GPT2"
* Bottom Section: "Sparse GPT2"
* **Heatmap Labels:** Each heatmap is labeled with a string in the format "L[Layer Number]H[Head Number]", where:
* Layer Number ranges from 0 to 11.
* Head Number ranges from 0 to 11.
* **Color Scale:** The heatmaps use a color gradient, presumably from light to dark blue, to represent the strength of attention. Lighter shades indicate weaker attention, while darker shades indicate stronger attention.
* **Axes:** Each heatmap has an x and y axis, representing the input sequence positions.
### Detailed Analysis
**GPT2 (Top Section):**
The heatmaps are arranged in a 6x6 grid. The labels for each heatmap are as follows:
* **Row 1:**
* Column 1: L0H0
* Column 2: L0H2
* Column 3: L5H5
* Column 4: L0H7
* Column 5: L0H1
* Column 6: L0H10
* **Row 2:**
* Column 1: L7H6
* Column 2: L3H10
* Column 3: L4H8
* Column 4: L2H11
* Column 5: L5H8
* Column 6: L6H7
* **Row 3:**
* Column 1: L3H0
* Column 2: L5H9
* Column 3: L7H1
* Column 4: L2H10
* Column 5: L7H2
* Column 6: L8H10
* **Row 4:**
* Column 1: L6H6
* Column 2: L7H11
* Column 3: L2H9
* Column 4: L1H4
* Column 5: L6H11
* Column 6: L3H8
* **Row 5:**
* Column 1: L9H5
* Column 2: L6H9
* Column 3: L4H9
* Column 4: L1H2
* Column 5: L11H10
* Column 6: L4H3
* **Row 6:**
* Column 1: L3H11
* Column 2: L6H8
* Column 3: L4H7
* Column 4: L0H6
* Column 5: L3H1
* Column 6: L5H7
**Sparse GPT2 (Bottom Section):**
The heatmaps are arranged in a single row. The labels for each heatmap are as follows:
* Column 1: L0H5
* Column 2: L5H1
* Column 3: L4H11
* Column 4: L6H8
* Column 5: L5H5
* Column 6: L1H0
* Column 7: L6H9
* Column 8: L3H4
### Key Observations
* **Diagonal Dominance:** Many of the heatmaps, especially in the standard GPT2 model, show a strong diagonal pattern, indicating that each position in the input sequence attends strongly to itself.
* **Vertical/Horizontal Lines:** Some heatmaps show vertical or horizontal lines, suggesting that certain positions attend to all other positions or that all positions attend to a specific position.
* **Sparsity in Sparse GPT2:** The Sparse GPT2 model exhibits significantly sparser attention patterns compared to the standard GPT2 model. This is evident from the presence of fewer off-diagonal elements with high attention scores.
* **Layer and Head Variation:** The attention patterns vary significantly across different layers and heads, indicating that different parts of the model learn different types of relationships between input positions.
### Interpretation
The heatmaps visualize the internal workings of the GPT2 models, showing how different parts of the model attend to different parts of the input sequence. The diagonal dominance suggests that self-attention is a crucial mechanism in these models. The variations in attention patterns across layers and heads indicate that the model learns a hierarchy of relationships, with some layers focusing on local dependencies and others focusing on long-range dependencies. The sparsity in the Sparse GPT2 model suggests that it learns to focus on a smaller subset of relationships, potentially leading to more efficient computation or different generalization properties. The image provides insights into the attention mechanisms of GPT2 models and how sparsity can affect these mechanisms.