\n
## Radar Chart: Performance Comparison
### Overview
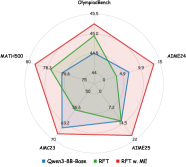
This image presents a radar chart comparing the performance of three entities – “Owen3-Base”, “RPT”, and “RPT w. ME” – across five metrics: MATH-B00, AZME24, ATME25, AMC23, and Olympickench. The chart uses a pentagonal shape, with each vertex representing one of the metrics. The values are plotted along each axis, radiating from the center (0) to a maximum value of 80 for MATH-B00 and AMC23, and 45 for Olympickench, 15 for AZME24 and 22 for ATME25.
### Components/Axes
* **Axes:** The chart has five axes, each labeled with a metric name:
* MATH-B00 (Scale: 0 to 80)
* AZME24 (Scale: 0 to 15)
* ATME25 (Scale: 0 to 22)
* AMC23 (Scale: 0 to 70)
* Olympickench (Scale: 0 to 45)
* **Legend:** Located in the bottom-left corner, the legend identifies the three data series:
* Owen3-Base (Blue line)
* RPT (Green line)
* RPT w. ME (Red line)
* **Center:** The center of the chart is marked with values 0, 30, 60.
### Detailed Analysis
Let's analyze each data series and their corresponding values:
**1. Owen3-Base (Blue Line):**
The line generally stays close to the center, indicating relatively low performance across all metrics.
* MATH-B00: ~42.2
* AZME24: ~4.5
* ATME25: ~7.2
* AMC23: ~36.6
* Olympickench: ~26.4
**2. RPT (Green Line):**
The RPT line shows significantly higher performance than Owen3-Base, particularly in MATH-B00 and Olympickench.
* MATH-B00: ~78.3
* AZME24: ~9.9
* ATME25: ~16.1
* AMC23: ~66.4
* Olympickench: ~44.5
**3. RPT w. ME (Red Line):**
The RPT w. ME line consistently outperforms both Owen3-Base and RPT, especially in MATH-B00, Olympickench and AMC23.
* MATH-B00: ~80
* AZME24: ~5.9
* ATME25: ~14.9
* AMC23: ~70
* Olympickench: ~43.2
### Key Observations
* **Performance Hierarchy:** RPT w. ME > RPT > Owen3-Base across all metrics.
* **Strongest Metric:** MATH-B00 shows the largest performance difference between the three entities. RPT w. ME and RPT have significantly higher scores than Owen3-Base.
* **Weakest Metric:** AZME24 consistently has the lowest scores for all three entities, suggesting it's a challenging metric.
* **ME Impact:** The addition of "ME" to RPT consistently improves performance, indicating a positive effect.
### Interpretation
The radar chart demonstrates a clear performance comparison between three entities. "Owen3-Base" represents a baseline or initial state, while "RPT" and "RPT w. ME" represent improvements or variations of that baseline. The addition of "ME" to the RPT model consistently enhances performance across all measured metrics.
The chart suggests that the "ME" component is a valuable addition to the RPT model, leading to substantial gains, particularly in MATH-B00, Olympickench and AMC23. The relatively low scores in AZME24 for all entities indicate a potential area for further investigation and improvement. The chart provides a visual representation of the strengths and weaknesses of each entity, allowing for targeted optimization efforts. The data suggests a positive correlation between the "ME" component and overall performance.