## Chart: SciQ Performance Comparison
### Overview
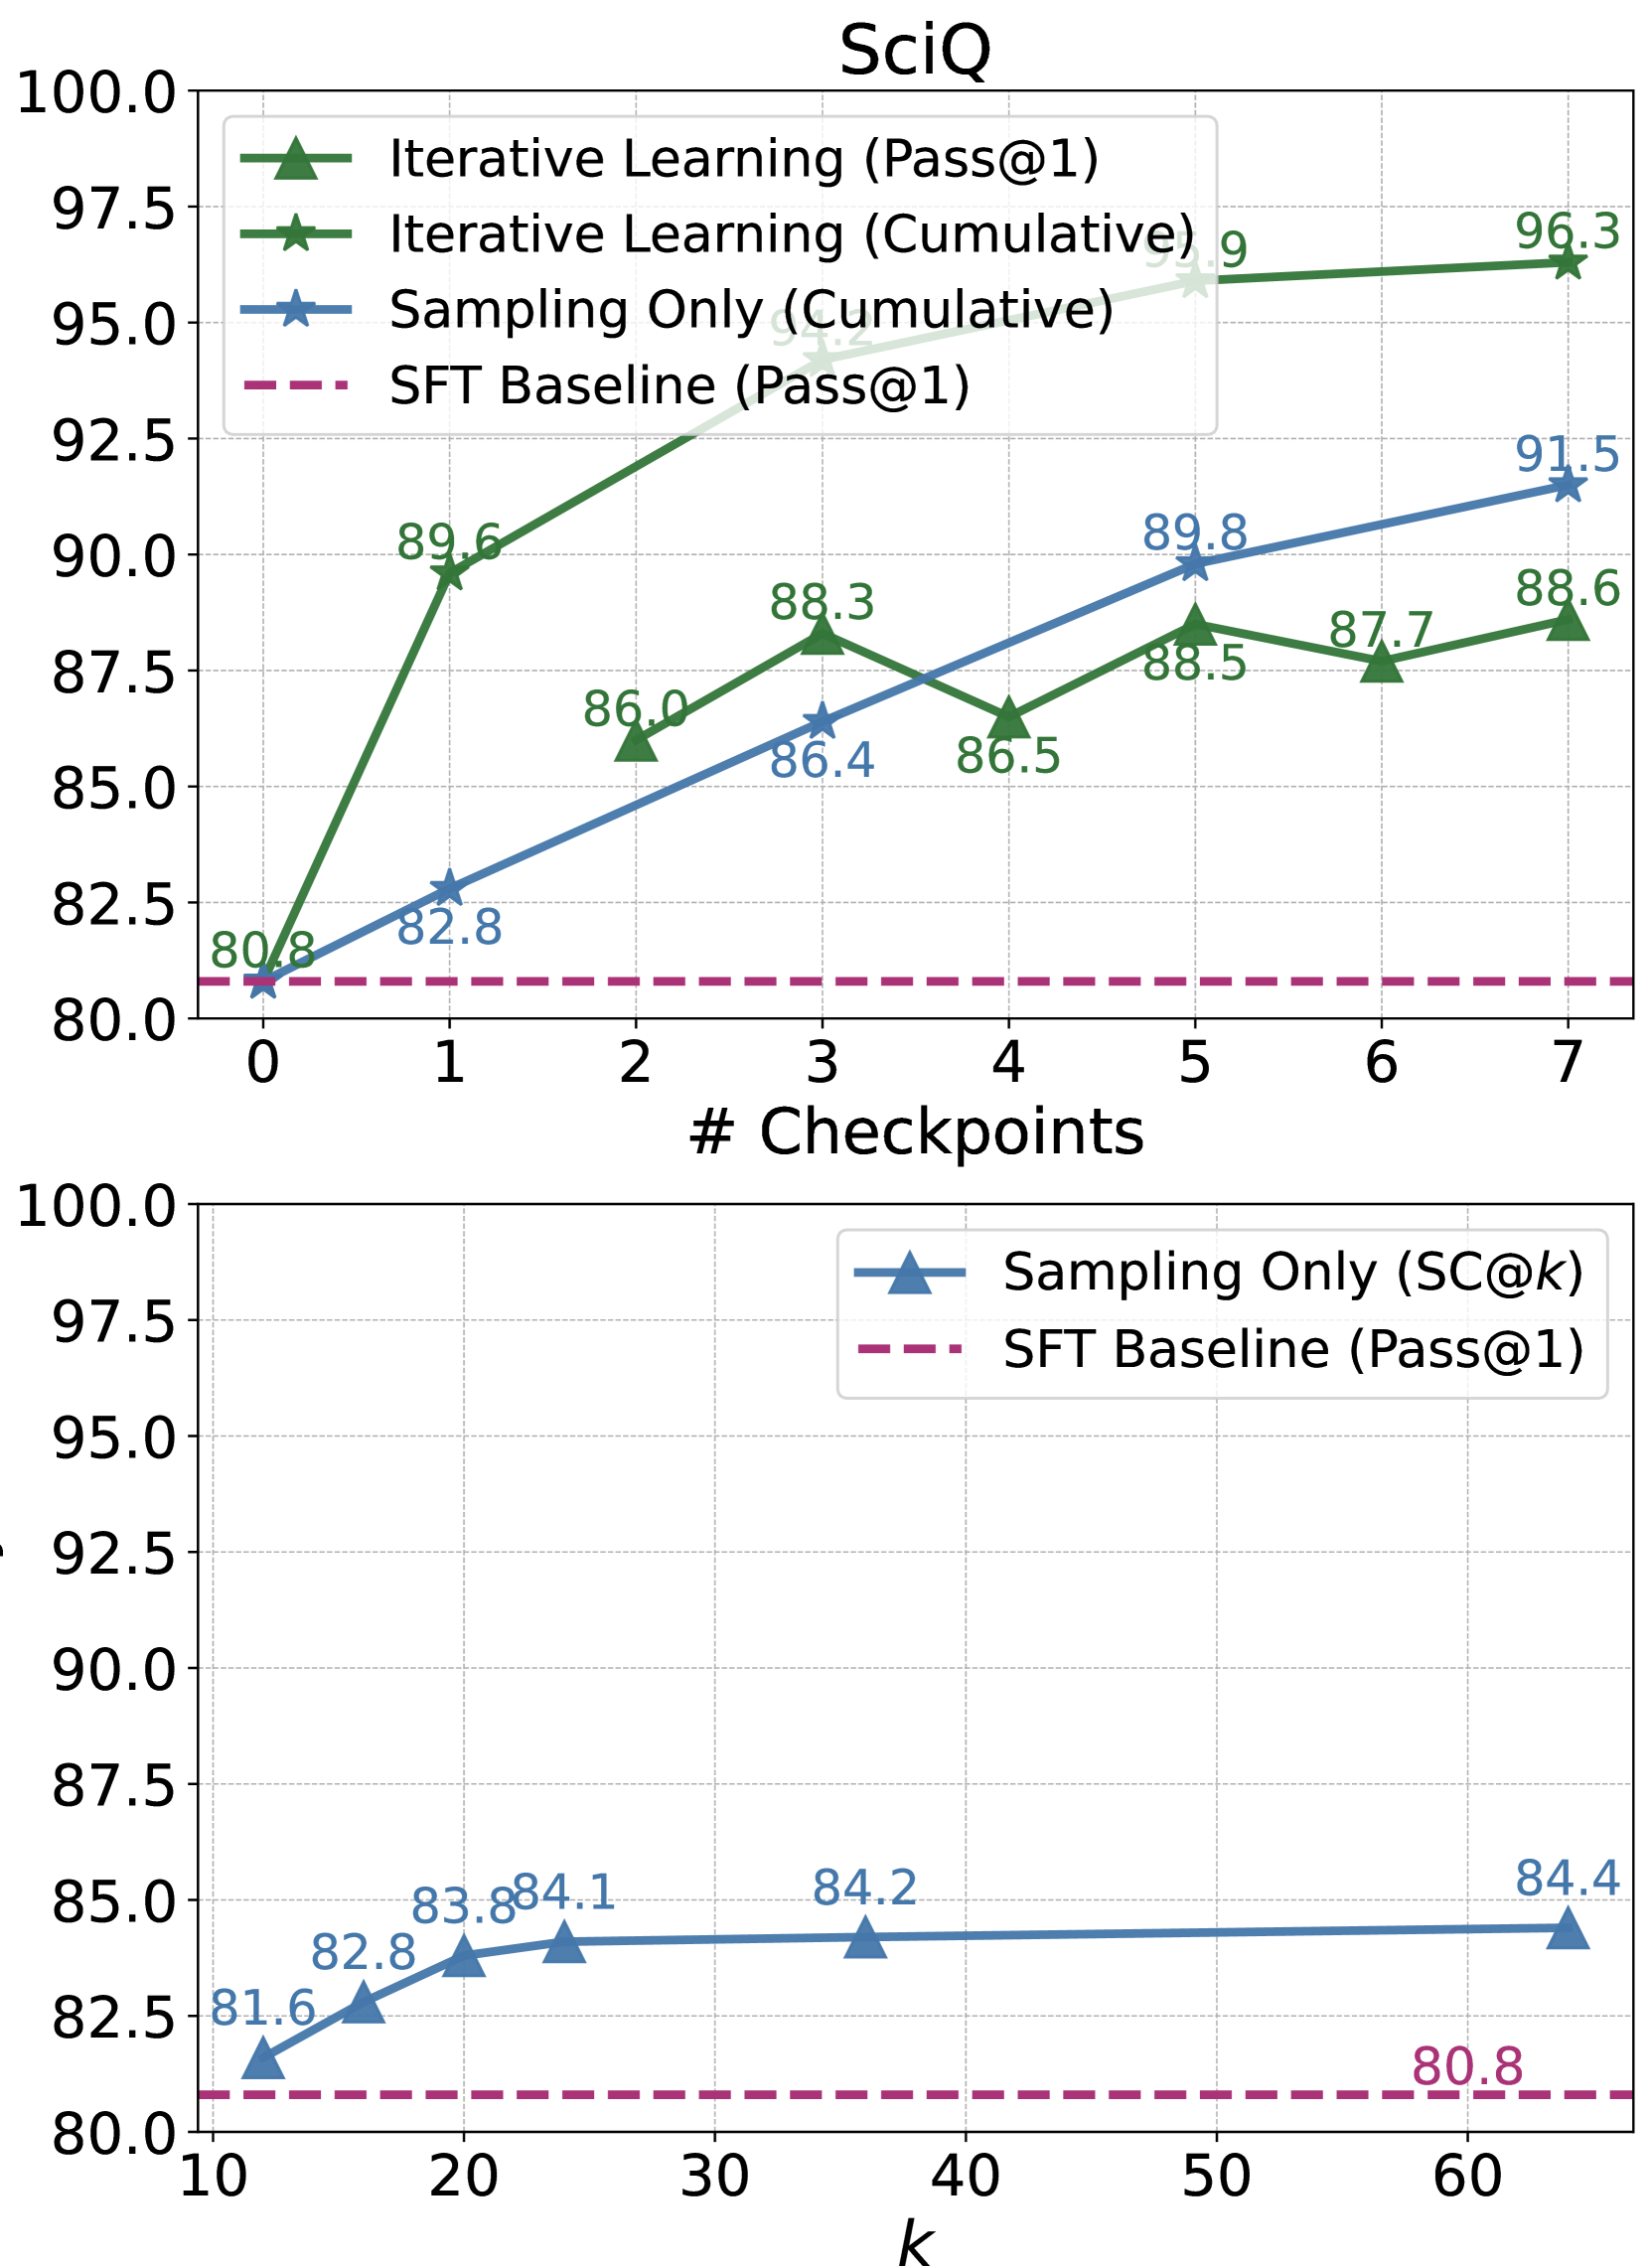
The image contains two line charts comparing the performance of different models on the SciQ dataset. The top chart compares "Iterative Learning" and "Sampling Only" models with a baseline, while the bottom chart focuses on "Sampling Only" with a different parameter (SC@k) and the same baseline. The y-axis represents performance, likely accuracy or a similar metric, while the x-axis represents either the number of checkpoints or the parameter 'k'.
### Components/Axes
**Top Chart:**
* **Title:** SciQ
* **X-axis:** "# Checkpoints"
* **Y-axis:** Values range from 80.0 to 100.0, with increments of 2.5.
* **Legend (Top-Left):**
* Green: Iterative Learning (Pass@1)
* Dark Green: Iterative Learning (Cumulative)
* Blue: Sampling Only (Cumulative)
* Dashed Purple: SFT Baseline (Pass@1)
**Bottom Chart:**
* **X-axis:** "k"
* **Y-axis:** Values range from 80.0 to 100.0, with increments of 2.5.
* **Legend (Top-Right):**
* Blue: Sampling Only (SC@k)
* Dashed Purple: SFT Baseline (Pass@1)
### Detailed Analysis
**Top Chart:**
* **Iterative Learning (Pass@1) - Green:** Starts at 80.8 at checkpoint 0, increases sharply to 89.6 at checkpoint 1, then to 86.0 at checkpoint 2, then to 88.3 at checkpoint 3, then to 88.5 at checkpoint 5, then to 87.7 at checkpoint 6, and ends at 88.6 at checkpoint 7.
* **Iterative Learning (Cumulative) - Dark Green:** Starts at 80.9 at checkpoint 0, increases sharply to 95.2 at checkpoint 5, and ends at 96.3 at checkpoint 7.
* **Sampling Only (Cumulative) - Blue:** Starts at 80.8 at checkpoint 0, increases to 82.8 at checkpoint 1, then to 86.4 at checkpoint 3, then to 86.5 at checkpoint 4, then to 89.8 at checkpoint 5, and ends at 91.5 at checkpoint 7.
* **SFT Baseline (Pass@1) - Dashed Purple:** Remains constant at approximately 80.8 across all checkpoints.
**Bottom Chart:**
* **Sampling Only (SC@k) - Blue:** Starts at 81.6 at k=10, increases to 82.8 at k=15, then to 83.8 at k=20, then to 84.1 at k=25, then to 84.2 at k=35, and ends at 84.4 at k=65.
* **SFT Baseline (Pass@1) - Dashed Purple:** Remains constant at approximately 80.8 across all values of k.
### Key Observations
* In the top chart, "Iterative Learning (Cumulative)" significantly outperforms the other models as the number of checkpoints increases.
* The "SFT Baseline (Pass@1)" consistently performs at around 80.8 in both charts, indicating a stable but lower performance level.
* In the bottom chart, "Sampling Only (SC@k)" shows a slight increase in performance as 'k' increases, but the improvement plateaus after k=25.
### Interpretation
The data suggests that iterative learning, especially in its cumulative form, is highly effective for the SciQ dataset when evaluated by number of checkpoints. The "Sampling Only" method shows improvement over the baseline, but its performance is significantly lower than "Iterative Learning (Cumulative)". The parameter 'k' in the bottom chart has a diminishing effect on the performance of "Sampling Only (SC@k)". The SFT Baseline provides a consistent but relatively low performance level, serving as a benchmark for the other models. The top chart shows the number of checkpoints has a large impact on the Iterative Learning models, while the bottom chart shows the parameter 'k' has a small impact on the Sampling Only model.