## Line Chart: SciQ Performance Comparison
### Overview
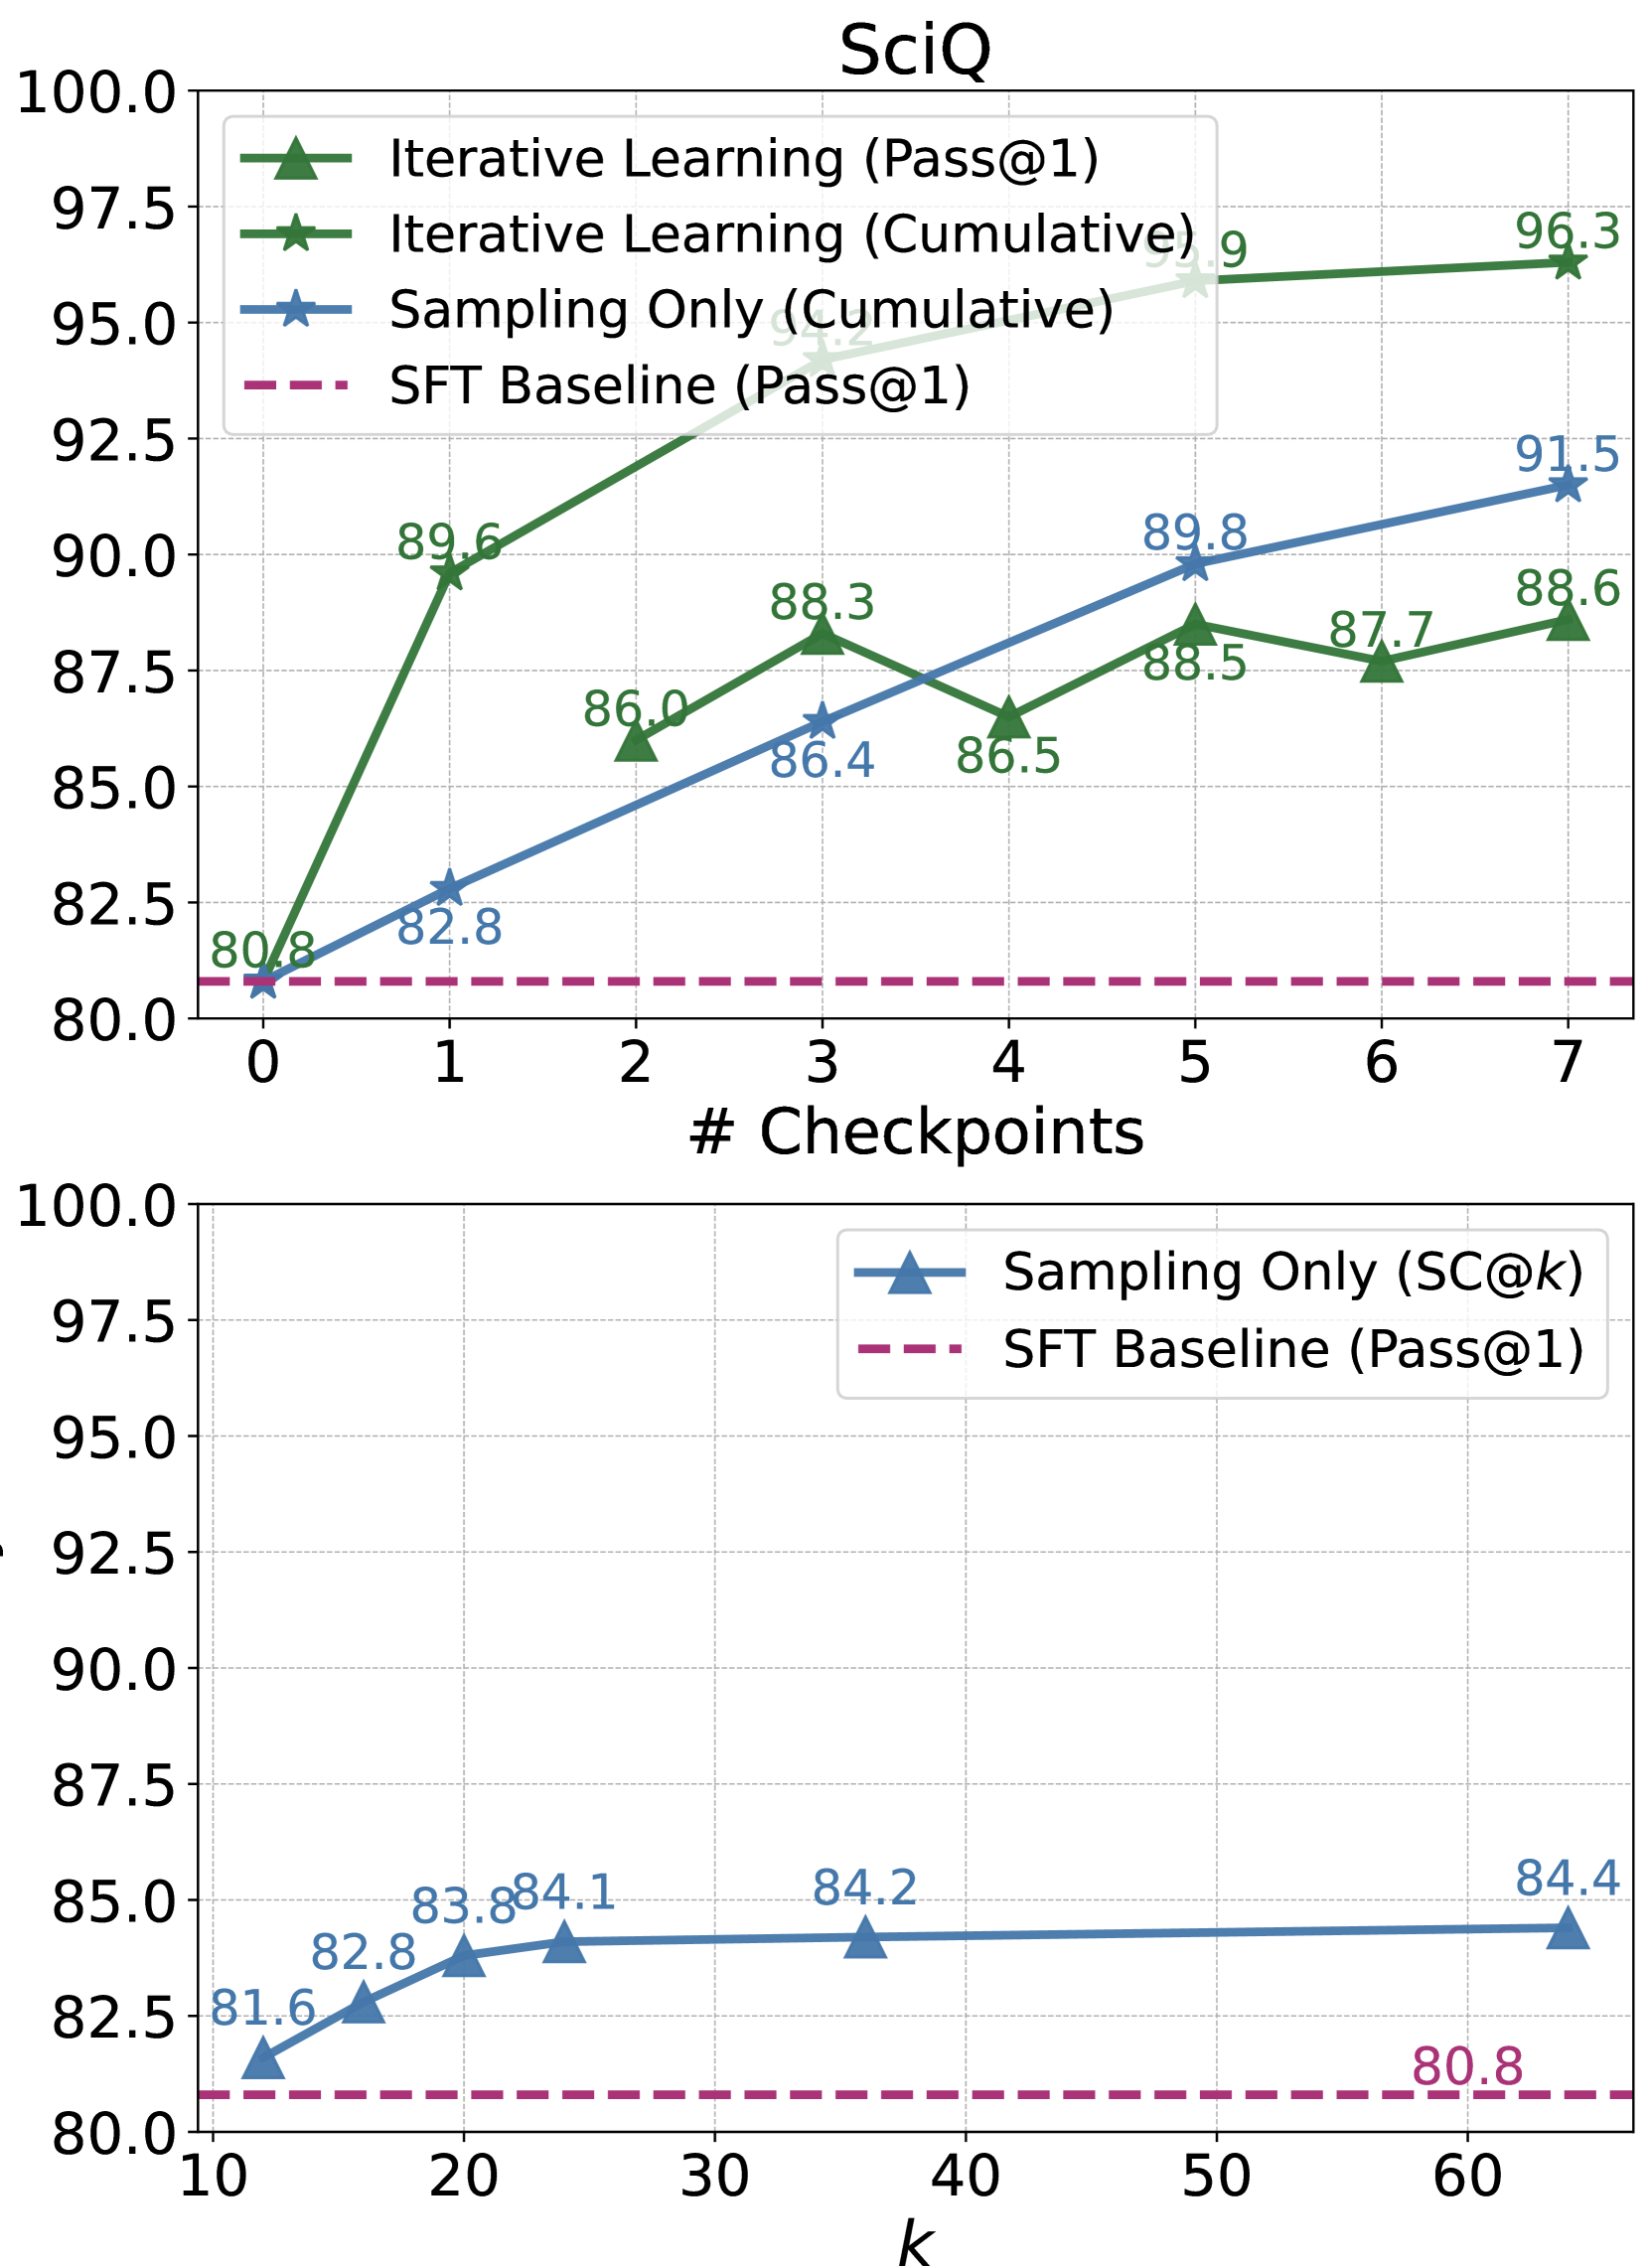
The image presents two line charts comparing the performance of different learning strategies on the SciQ dataset. The top chart compares "Iterative Learning" (both Pass@1 and Cumulative) against an "SFT Baseline" (Pass@1) as a function of the number of checkpoints. The bottom chart compares "Sampling Only" (SC@k) against the same "SFT Baseline" as a function of 'k'. Both charts share a similar y-axis scale, representing performance scores, and use a dashed red line to denote the SFT Baseline.
### Components/Axes
* **Title:** SciQ (appears above both charts)
* **Top Chart:**
* **X-axis Label:** # Checkpoints (ranging from 0 to 7)
* **Y-axis Label:** (Scale from 80.0 to 100.0)
* **Legend:**
* Iterative Learning (Pass@1) - Green triangles
* Iterative Learning (Cumulative) - Light green triangles
* Sampling Only (Cumulative) - Gray line
* SFT Baseline (Pass@1) - Dashed red line
* **Bottom Chart:**
* **X-axis Label:** k (ranging from 10 to 60)
* **Y-axis Label:** (Scale from 80.0 to 100.0)
* **Legend:**
* Sampling Only (SC@k) - Blue triangles
* SFT Baseline (Pass@1) - Dashed red line
### Detailed Analysis or Content Details
**Top Chart:**
* **SFT Baseline (Pass@1):** The dashed red line remains relatively constant at approximately 82.8 across all checkpoints.
* **Iterative Learning (Pass@1):** Starts at 80.8 at checkpoint 0, rises sharply to 89.6 at checkpoint 1, then fluctuates around 86-88.6 until checkpoint 6, and finally reaches 96.3 at checkpoint 7.
* **Iterative Learning (Cumulative):** Starts at 80.8 at checkpoint 0, rises to 86.0 at checkpoint 2, then increases to 88.3 at checkpoint 3, and reaches 88.5 at checkpoint 5, and finally reaches 91.5 at checkpoint 7.
* **Sampling Only (Cumulative):** Starts at 82.8 at checkpoint 0, rises to 86.4 at checkpoint 2, then increases to 86.5 at checkpoint 4, and remains at 87.7 at checkpoint 6.
**Bottom Chart:**
* **SFT Baseline (Pass@1):** The dashed red line remains relatively constant at approximately 80.8 across all k values.
* **Sampling Only (SC@k):** Starts at 81.6 at k=10, rises steadily to 82.8 at k=20, then continues to increase to 84.1 at k=30, 84.2 at k=40, 84.4 at k=60.
### Key Observations
* In the top chart, "Iterative Learning (Pass@1)" significantly outperforms the "SFT Baseline" after the first checkpoint.
* "Iterative Learning (Cumulative)" shows a more gradual improvement compared to "Iterative Learning (Pass@1)".
* "Sampling Only (Cumulative)" shows a modest improvement over the baseline in the top chart.
* In the bottom chart, "Sampling Only (SC@k)" consistently outperforms the "SFT Baseline", but the improvement is relatively small.
* The "SFT Baseline" remains remarkably stable across both charts.
### Interpretation
The data suggests that iterative learning strategies are effective in improving performance on the SciQ dataset, particularly when evaluated using the Pass@1 metric. The initial jump in performance at checkpoint 1 for "Iterative Learning (Pass@1)" indicates a rapid learning phase. The cumulative learning curves show a slower, more consistent improvement.
The "Sampling Only" strategy also demonstrates improvement over the baseline, but to a lesser extent than iterative learning. The consistent performance of the "SFT Baseline" suggests it represents a lower bound on achievable performance.
The difference between the Pass@1 and Cumulative metrics for Iterative Learning indicates that while the model quickly learns to provide correct answers in some cases (Pass@1), the overall consistency and reliability of its responses (Cumulative) improves more gradually.
The bottom chart shows that increasing 'k' in the sampling strategy leads to incremental gains, suggesting that exploring a larger sample space can improve performance, but with diminishing returns. The relatively small gains compared to the top chart suggest that the sampling strategy alone is not as effective as the iterative learning approach.