## Line Graph: Probability Distribution at T = 0.31, Instance 2
### Overview
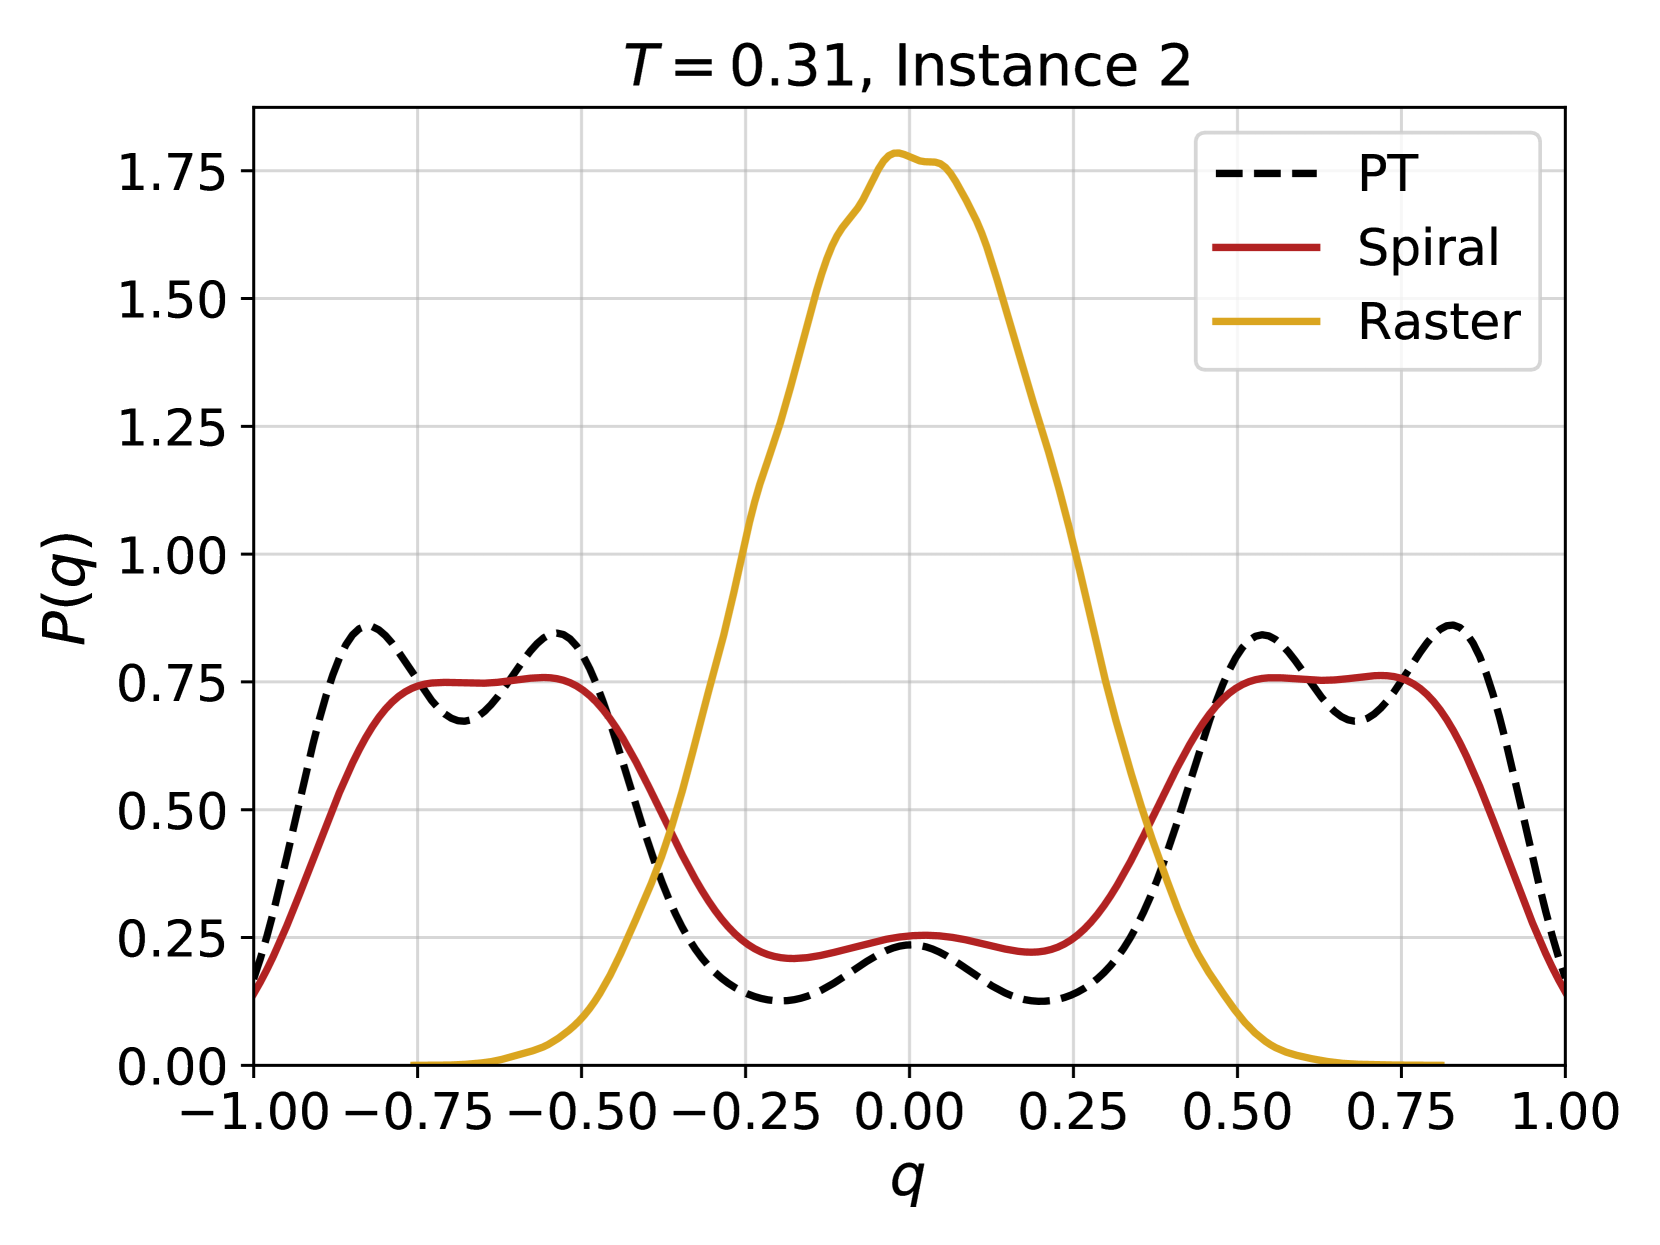
The image depicts a line graph comparing three probability distributions (PT, Spiral, Raster) across a normalized parameter `q` ranging from -1.00 to 1.00. The y-axis represents probability `P(q)`, scaled from 0.00 to 1.75. The graph highlights distinct peak structures and symmetry patterns among the distributions.
### Components/Axes
- **X-axis (q)**: Normalized parameter ranging from -1.00 to 1.00 in increments of 0.25.
- **Y-axis (P(q))**: Probability values from 0.00 to 1.75 in increments of 0.25.
- **Legend**: Located in the top-right corner, with three entries:
- **PT**: Dashed black line
- **Spiral**: Solid red line
- **Raster**: Solid yellow line
### Detailed Analysis
1. **PT (Dashed Black Line)**:
- Symmetric distribution with two peaks at `q ≈ -0.75` and `q ≈ 0.75`.
- Peak height ≈ 0.75.
- Minima at `q ≈ -0.25` and `q ≈ 0.25` (≈0.25 probability).
2. **Spiral (Solid Red Line)**:
- Similar symmetry to PT but with slightly lower peaks (≈0.70).
- Minima at `q ≈ -0.25` and `q ≈ 0.25` (≈0.20 probability).
- Gradual decline toward `q = ±1.00`.
3. **Raster (Solid Yellow Line)**:
- Single sharp peak at `q = 0.00` (≈1.75 probability).
- Rapid decline to near-zero values at `q = ±0.50`.
- No secondary peaks observed.
### Key Observations
- **Raster** exhibits the highest probability density at `q = 0.00`, exceeding both PT and Spiral.
- **PT** and **Spiral** show mirrored distributions, suggesting symmetric behavior around `q = 0.00`.
- All distributions decay to near-zero values at `q = ±1.00`.
### Interpretation
The graph likely compares the performance or characteristics of three computational methods (PT, Spiral, Raster) in modeling a probabilistic system at temperature `T = 0.31`. The Raster method demonstrates a highly concentrated probability distribution at `q = 0.00`, indicating a strong preference for this state. In contrast, PT and Spiral methods exhibit broader, symmetric distributions, suggesting more distributed or exploratory behavior. The symmetry of PT and Spiral implies potential equilibrium or balanced dynamics, while Raster’s sharp peak may reflect a deterministic or localized outcome. The temperature parameter `T = 0.31` likely modulates the system’s sensitivity, with lower temperatures potentially favoring sharper distributions (as seen in Raster).