# Technical Data Extraction: Performance Comparison Across Metrics
This document provides a detailed extraction of data from a series of four bar charts comparing different Large Language Model (LLM) prompting and architectural strategies across four distinct evaluation metrics.
## 1. Document Overview
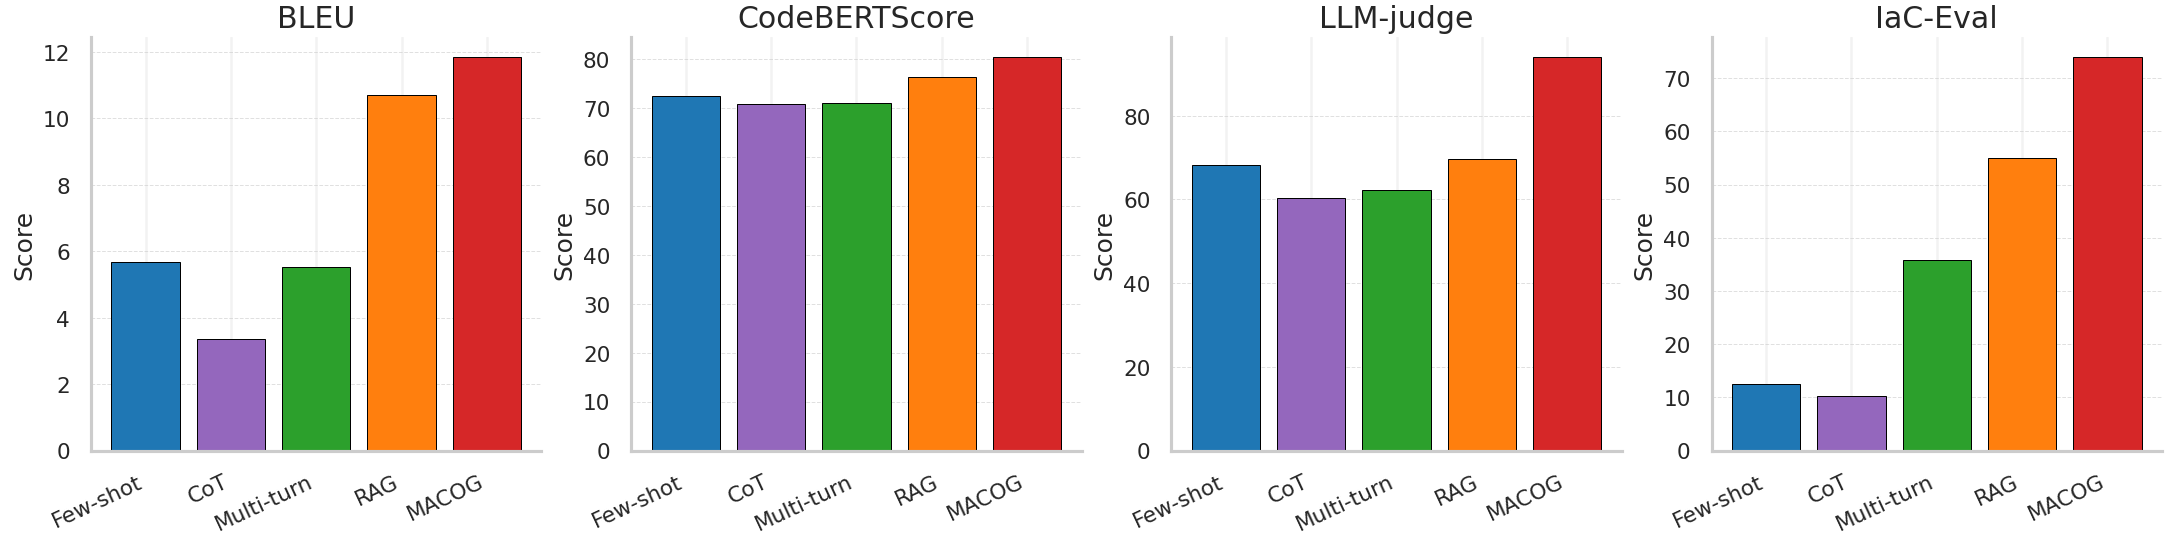
The image consists of four side-by-side bar charts. Each chart represents a different evaluation metric. The x-axis for all charts contains five categories (methods), and the y-axis represents the "Score" for that specific metric.
### Global Categories (X-Axis)
The following five methods are evaluated in each chart, listed here with their corresponding bar colors:
1. **Few-shot**: Blue
2. **CoT** (Chain of Thought): Purple
3. **Multi-turn**: Green
4. **RAG** (Retrieval-Augmented Generation): Orange
5. **MACOG**: Red
---
## 2. Detailed Metric Analysis
### Chart 1: BLEU
* **Y-Axis Range**: 0 to 12 (increments of 2).
* **Trend Observation**: Performance is relatively low for the first three methods, with a significant jump for RAG and a peak at MACOG.
* **Extracted Data (Approximate Values):**
* **Few-shot (Blue)**: ~5.7
* **CoT (Purple)**: ~3.4
* **Multi-turn (Green)**: ~5.5
* **RAG (Orange)**: ~10.7
* **MACOG (Red)**: ~11.8
### Chart 2: CodeBERTScore
* **Y-Axis Range**: 0 to 80 (increments of 10).
* **Trend Observation**: High baseline performance across all methods (>70). There is a slight dip for CoT/Multi-turn, followed by a steady increase through RAG to MACOG.
* **Extracted Data (Approximate Values):**
* **Few-shot (Blue)**: ~72.5
* **CoT (Purple)**: ~71.0
* **Multi-turn (Green)**: ~71.0
* **RAG (Orange)**: ~76.5
* **MACOG (Red)**: ~80.5
### Chart 3: LLM-judge
* **Y-Axis Range**: 0 to 80+ (labeled up to 80, top bar exceeds 90).
* **Trend Observation**: Similar to BLEU, CoT shows a slight decrease from Few-shot. There is a consistent upward trend from Multi-turn through MACOG.
* **Extracted Data (Approximate Values):**
* **Few-shot (Blue)**: ~68.0
* **CoT (Purple)**: ~60.0
* **Multi-turn (Green)**: ~62.0
* **RAG (Orange)**: ~70.0
* **MACOG (Red)**: ~95.0
### Chart 4: IaC-Eval
* **Y-Axis Range**: 0 to 70+ (labeled up to 70, top bar exceeds 70).
* **Trend Observation**: This metric shows the most dramatic variance. While Few-shot and CoT perform poorly, there is a massive step-wise increase for Multi-turn, RAG, and finally MACOG.
* **Extracted Data (Approximate Values):**
* **Few-shot (Blue)**: ~12.5
* **CoT (Purple)**: ~10.0
* **Multi-turn (Green)**: ~36.0
* **RAG (Orange)**: ~55.0
* **MACOG (Red)**: ~74.0
---
## 3. Summary Data Table
The following table reconstructs the visual data into a structured format.
| Method | BLEU | CodeBERTScore | LLM-judge | IaC-Eval |
| :--- | :---: | :---: | :---: | :---: |
| **Few-shot** | ~5.7 | ~72.5 | ~68.0 | ~12.5 |
| **CoT** | ~3.4 | ~71.0 | ~60.0 | ~10.0 |
| **Multi-turn** | ~5.5 | ~71.0 | ~62.0 | ~36.0 |
| **RAG** | ~10.7 | ~76.5 | ~70.0 | ~55.0 |
| **MACOG** | **~11.8** | **~80.5** | **~95.0** | **~74.0** |
## 4. Key Findings
* **Top Performer**: **MACOG (Red)** consistently achieves the highest score across all four evaluation metrics.
* **RAG Performance**: RAG (Orange) is consistently the second-best performer, showing significant improvements over standard prompting methods.
* **CoT Anomaly**: In three out of four metrics (BLEU, LLM-judge, IaC-Eval), the **CoT (Purple)** method actually performs slightly worse than the standard **Few-shot (Blue)** method.
* **Metric Sensitivity**: The **IaC-Eval** metric shows the highest sensitivity to the architectural changes (Multi-turn, RAG, MACOG), with the largest relative gains between categories.