# Technical Document Extraction: Bar Chart Analysis
## Chart Overview
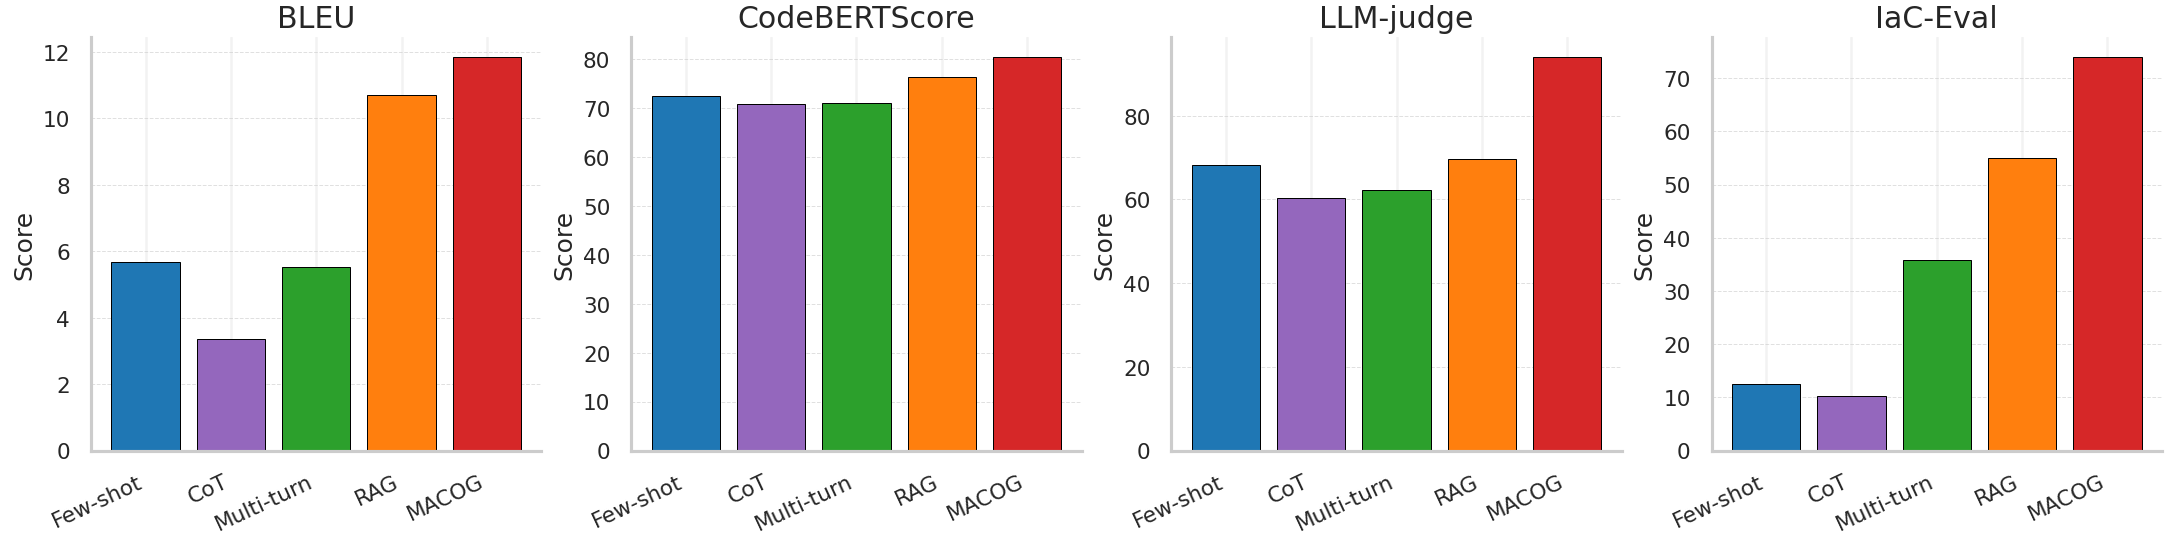
The image contains **four bar charts** comparing performance metrics across five categories: **Few-shot, CoT, Multi-turn, RAG, MACOG**. Each chart uses a consistent color scheme for categories:
- **Blue**: Few-shot
- **Purple**: CoT
- **Green**: Multi-turn
- **Orange**: RAG
- **Red**: MACOG
---
### 1. **BLEU Chart**
- **Y-axis**: Score (0–12)
- **Data Points**:
| Category | Score |
|------------|-------|
| Few-shot | ~6 |
| CoT | ~3 |
| Multi-turn | ~5 |
| RAG | ~10 |
| MACOG | ~12 |
---
### 2. **CodeBERTScore Chart**
- **Y-axis**: Score (0–80)
- **Data Points**:
| Category | Score |
|------------|-------|
| Few-shot | ~70 |
| CoT | ~70 |
| Multi-turn | ~70 |
| RAG | ~75 |
| MACOG | ~80 |
---
### 3. **LLM-judge Chart**
- **Y-axis**: Score (0–80)
- **Data Points**:
| Category | Score |
|------------|-------|
| Few-shot | ~70 |
| CoT | ~70 |
| Multi-turn | ~70 |
| RAG | ~75 |
| MACOG | ~80 |
---
### 4. **EM Chart**
- **Y-axis**: Score (0–80)
- **Data Points**:
| Category | Score |
|------------|-------|
| Few-shot | ~70 |
| CoT | ~70 |
| Multi-turn | ~70 |
| RAG | ~75 |
| MACOG | ~80 |