## Line Chart: Step Length vs Reasoning Tokens for Zero Shot Hard Blocksworld
### Overview
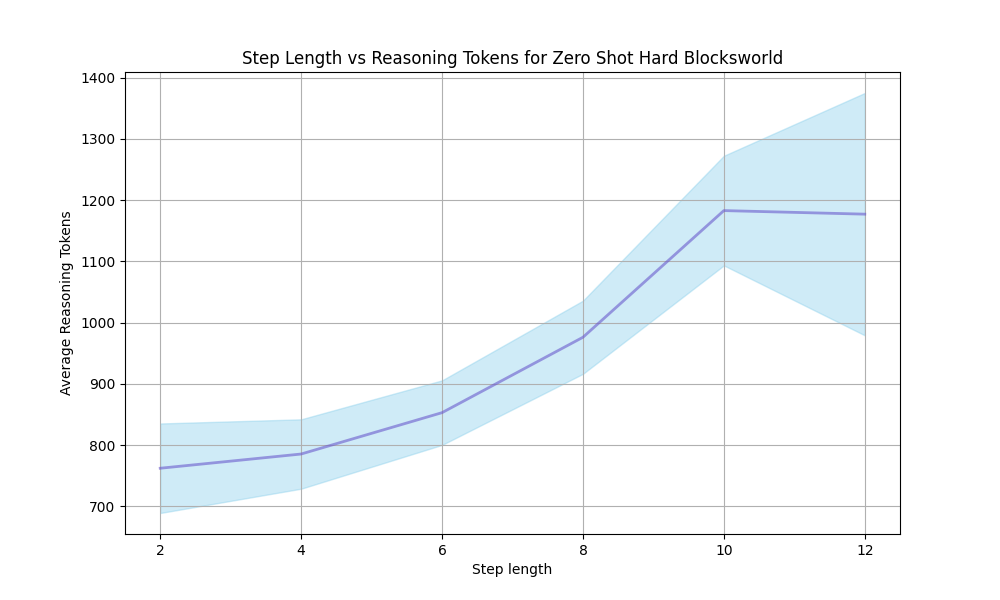
The image is a line chart that plots the relationship between "Step Length" and "Average Reasoning Tokens" for a "Zero Shot Hard Blocksworld" scenario. The chart displays a trend line with a shaded area around it, presumably representing the variance or confidence interval.
### Components/Axes
* **Title:** Step Length vs Reasoning Tokens for Zero Shot Hard Blocksworld
* **X-axis:**
* Label: Step length
* Scale: 2, 4, 6, 8, 10, 12
* **Y-axis:**
* Label: Average Reasoning Tokens
* Scale: 700, 800, 900, 1000, 1100, 1200, 1300, 1400
* **Data Series:**
* A single line in light purple, with a light blue shaded area around it. This represents the average reasoning tokens for each step length.
### Detailed Analysis
The data series shows how the average reasoning tokens change with increasing step length.
* **Step Length 2:** Average Reasoning Tokens ≈ 760
* **Step Length 4:** Average Reasoning Tokens ≈ 800
* **Step Length 6:** Average Reasoning Tokens ≈ 850
* **Step Length 8:** Average Reasoning Tokens ≈ 970
* **Step Length 10:** Average Reasoning Tokens ≈ 1180
* **Step Length 12:** Average Reasoning Tokens ≈ 1180
The shaded area around the line indicates the variability in the reasoning tokens. The width of the shaded area varies with the step length.
### Key Observations
* The average reasoning tokens generally increase with step length.
* The rate of increase appears to slow down after step length 10.
* The variability in reasoning tokens, as indicated by the shaded area, seems to increase with step length up to step length 10, then decreases at step length 12.
### Interpretation
The chart suggests that as the step length increases in the Zero Shot Hard Blocksworld environment, the average reasoning tokens required also increase. This could indicate that longer step lengths require more complex reasoning. The flattening of the curve after step length 10 might suggest a saturation point, where further increases in step length do not significantly increase the reasoning complexity. The shaded area represents the variance in the data, and the increase in variance with step length could indicate that longer step lengths lead to more diverse reasoning paths. The decrease in variance at step length 12 is an anomaly.