## Line Chart with Confidence Band: Step Length vs Reasoning Tokens for Zero Shot Hard Blocksworld
### Overview
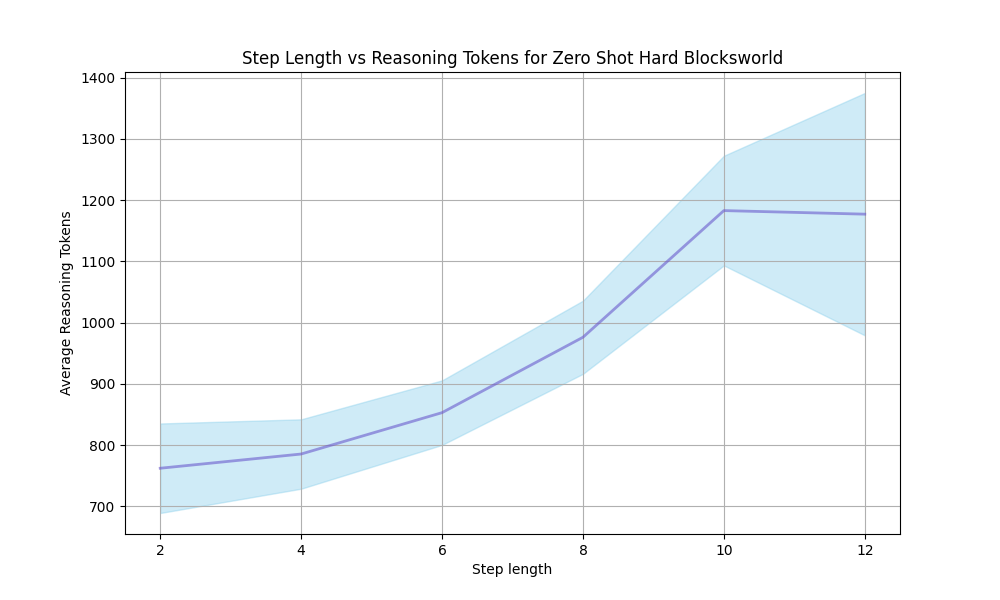
The image displays a line chart illustrating the relationship between "Step length" (x-axis) and "Average Reasoning Tokens" (y-axis) for a task identified as "Zero Shot Hard Blocksworld." The chart features a central trend line (purple) surrounded by a shaded light blue region, which likely represents a confidence interval, standard deviation, or range of variability around the average.
### Components/Axes
* **Title:** "Step Length vs Reasoning Tokens for Zero Shot Hard Blocksworld" (centered at the top).
* **X-Axis:**
* **Label:** "Step length" (centered below the axis).
* **Scale:** Linear scale with major tick marks and labels at 2, 4, 6, 8, 10, and 12.
* **Y-Axis:**
* **Label:** "Average Reasoning Tokens" (centered to the left, rotated 90 degrees).
* **Scale:** Linear scale with major tick marks and labels at 700, 800, 900, 1000, 1100, 1200, 1300, and 1400.
* **Data Series:**
* A single purple line representing the average trend.
* A light blue shaded area surrounding the purple line, representing the variability or confidence band.
* **Legend:** No explicit legend is present within the chart area. The single data series and its associated band are self-explanatory from the title and axes.
* **Grid:** A light gray grid is present, with both horizontal and vertical lines aligned with the major tick marks.
### Detailed Analysis
**Trend Verification:** The purple line shows a clear, consistent upward trend from left to right. The slope is gentle initially and becomes steeper after step length 6, before flattening slightly between step lengths 10 and 12.
**Data Point Extraction (Approximate Values):**
* **Step Length 2:**
* Average (Purple Line): ~760 tokens
* Range (Shaded Area): ~690 to ~835 tokens
* **Step Length 4:**
* Average (Purple Line): ~785 tokens
* Range (Shaded Area): ~725 to ~845 tokens
* **Step Length 6:**
* Average (Purple Line): ~855 tokens
* Range (Shaded Area): ~800 to ~905 tokens
* **Step Length 8:**
* Average (Purple Line): ~980 tokens
* Range (Shaded Area): ~915 to ~1040 tokens
* **Step Length 10:**
* Average (Purple Line): ~1185 tokens
* Range (Shaded Area): ~1090 to ~1275 tokens
* **Step Length 12:**
* Average (Purple Line): ~1180 tokens (appears to plateau or slightly decrease from step 10)
* Range (Shaded Area): ~980 to ~1375 tokens (widest range)
### Key Observations
1. **Positive Correlation:** There is a strong positive correlation between step length and the average number of reasoning tokens required. Longer step lengths demand more reasoning.
2. **Accelerating Increase:** The rate of increase in reasoning tokens accelerates. The slope is relatively shallow between steps 2-6, steepens significantly between steps 6-10, and then plateaus.
3. **Increasing Variability:** The width of the shaded blue region (variability) increases substantially with step length. The range is narrowest at step length 2 (~145 tokens) and widest at step length 12 (~395 tokens). This indicates that predictions become less certain or outcomes more variable as the problem complexity (step length) grows.
4. **Potential Saturation/Plateau:** The average reasoning tokens peak at step length 10 (~1185) and show a very slight decrease or plateau at step length 12 (~1180). However, the massive increase in variability at step 12 makes this point less reliable.
### Interpretation
This chart suggests that for the "Zero Shot Hard Blocksworld" task, the computational or cognitive effort (measured in reasoning tokens) required to solve a problem increases non-linearly with the problem's inherent complexity (step length). The initial increase is modest, but beyond a certain point (around step length 6), the effort required grows rapidly.
The most critical insight is the **dramatic increase in uncertainty** (wider shaded band) for longer step lengths. This implies that while the *average* effort plateaus, the *actual* effort for any given instance of a long-step problem becomes highly unpredictable. Some long problems might be solved with near-average effort, while others could require vastly more reasoning tokens (up to ~1375 at step 12), or occasionally fewer. This high variance could be due to the specific configuration of the blocksworld problem at longer step lengths, where some are deceptively simple and others are exceptionally tricky, even within the "hard" category.
In summary, the data demonstrates that scaling problem length in this domain leads to both higher average cost and, more importantly, a significant loss of predictability in the reasoning process required.