## Scatter Plot: Avg. test-time compute vs. Game Config
### Overview
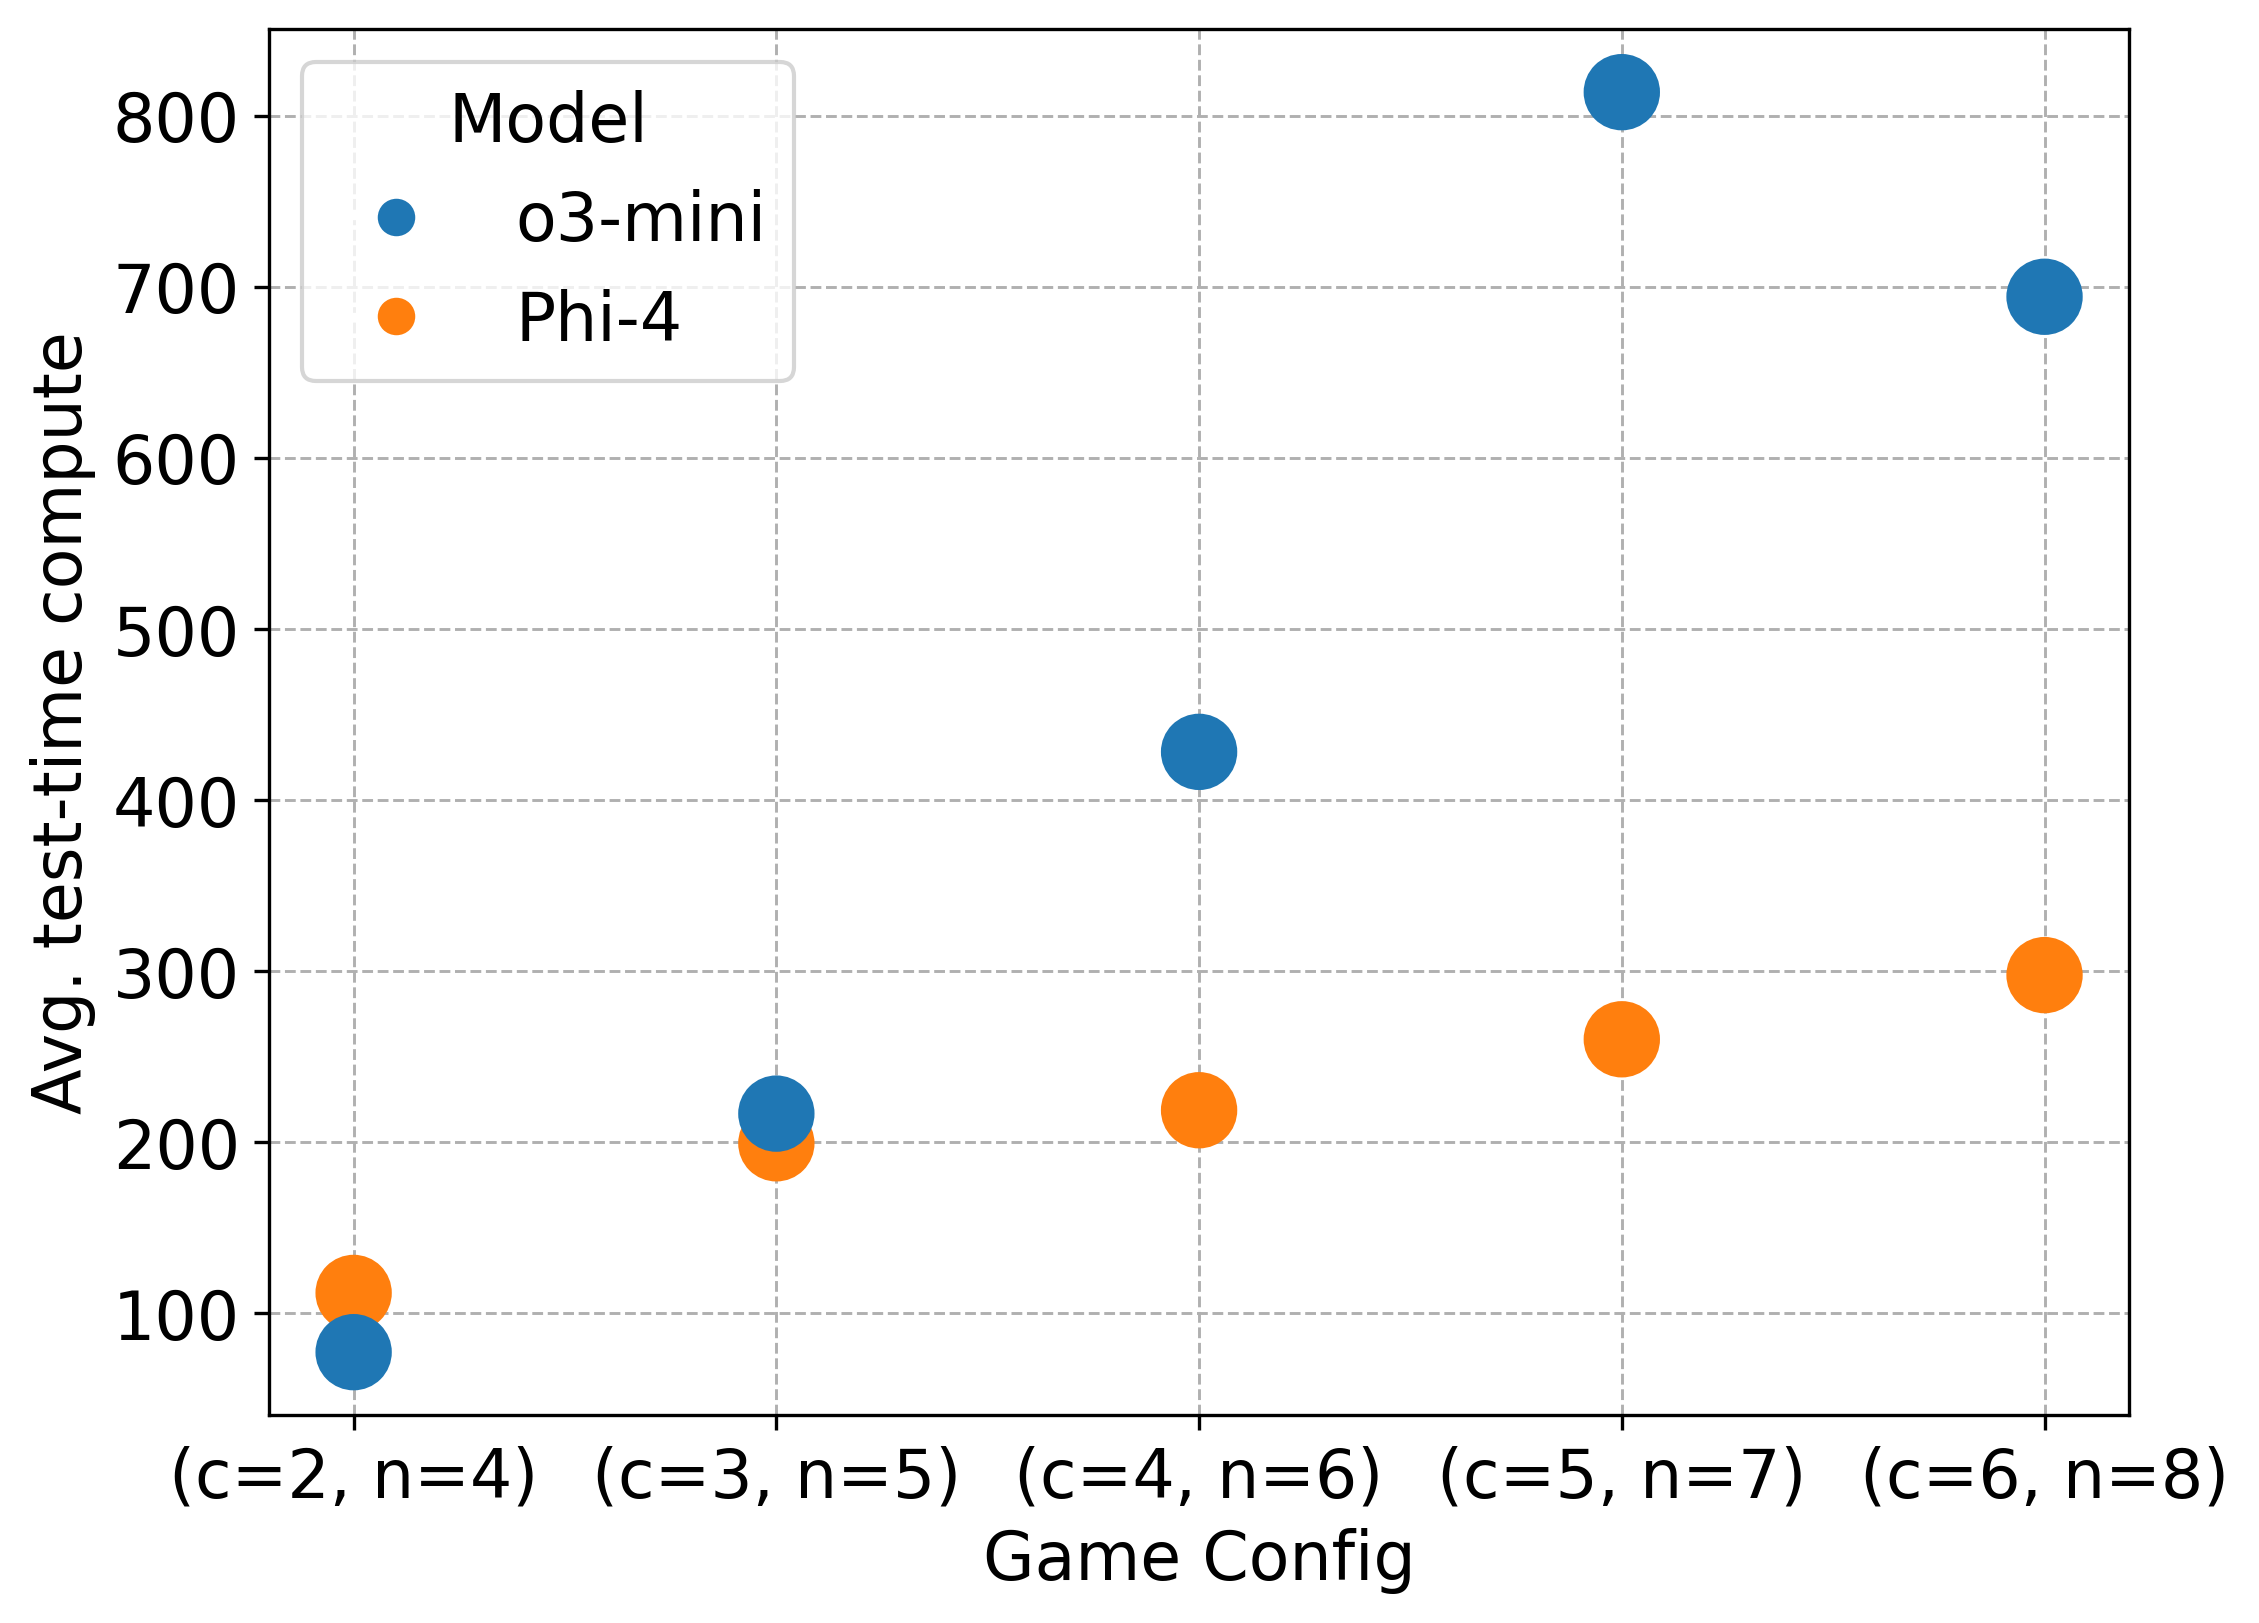
The image is a scatter plot comparing the average test-time compute for two models, o3-mini and Phi-4, across different game configurations. The x-axis represents the game configuration, denoted as (c=x, n=y), and the y-axis represents the average test-time compute.
### Components/Axes
* **Title:** None
* **X-axis:**
* **Label:** Game Config
* **Markers:** (c=2, n=4), (c=3, n=5), (c=4, n=6), (c=5, n=7), (c=6, n=8)
* **Y-axis:**
* **Label:** Avg. test-time compute
* **Markers:** 100, 200, 300, 400, 500, 600, 700, 800
* **Legend:** Located in the top-left corner.
* **Title:** Model
* **Entries:**
* o3-mini (blue)
* Phi-4 (orange)
### Detailed Analysis
* **o3-mini (blue):**
* **(c=2, n=4):** Approximately 80
* **(c=3, n=5):** Approximately 220
* **(c=4, n=6):** Approximately 430
* **(c=5, n=7):** Approximately 810
* **(c=6, n=8):** Approximately 700
* **Trend:** The average test-time compute increases significantly from (c=2, n=4) to (c=5, n=7), then decreases slightly at (c=6, n=8).
* **Phi-4 (orange):**
* **(c=2, n=4):** Approximately 110
* **(c=3, n=5):** Approximately 200
* **(c=4, n=6):** Approximately 220
* **(c=5, n=7):** Approximately 260
* **(c=6, n=8):** Approximately 300
* **Trend:** The average test-time compute increases gradually from (c=2, n=4) to (c=6, n=8).
### Key Observations
* The o3-mini model has a much higher average test-time compute for game configurations (c=5, n=7) and (c=6, n=8) compared to Phi-4.
* For lower game configurations (c=2, n=4) and (c=3, n=5), the average test-time compute is relatively similar for both models.
* The o3-mini model exhibits a non-linear trend, with a sharp increase in compute time at higher game configurations.
* The Phi-4 model shows a more linear and gradual increase in compute time as the game configuration increases.
### Interpretation
The scatter plot illustrates the performance of two models, o3-mini and Phi-4, in terms of average test-time compute across different game configurations. The data suggests that the o3-mini model becomes significantly more computationally expensive as the game configuration increases, particularly at (c=5, n=7), while Phi-4 maintains a more stable and gradual increase in compute time. This could indicate that Phi-4 is more scalable or efficient for larger or more complex game configurations. The similar performance at lower configurations suggests that o3-mini might be suitable for simpler games, but Phi-4 is preferable for more complex scenarios due to its better scalability.