## Scatter Plot: Avg. test-time compute vs. Game Config
### Overview
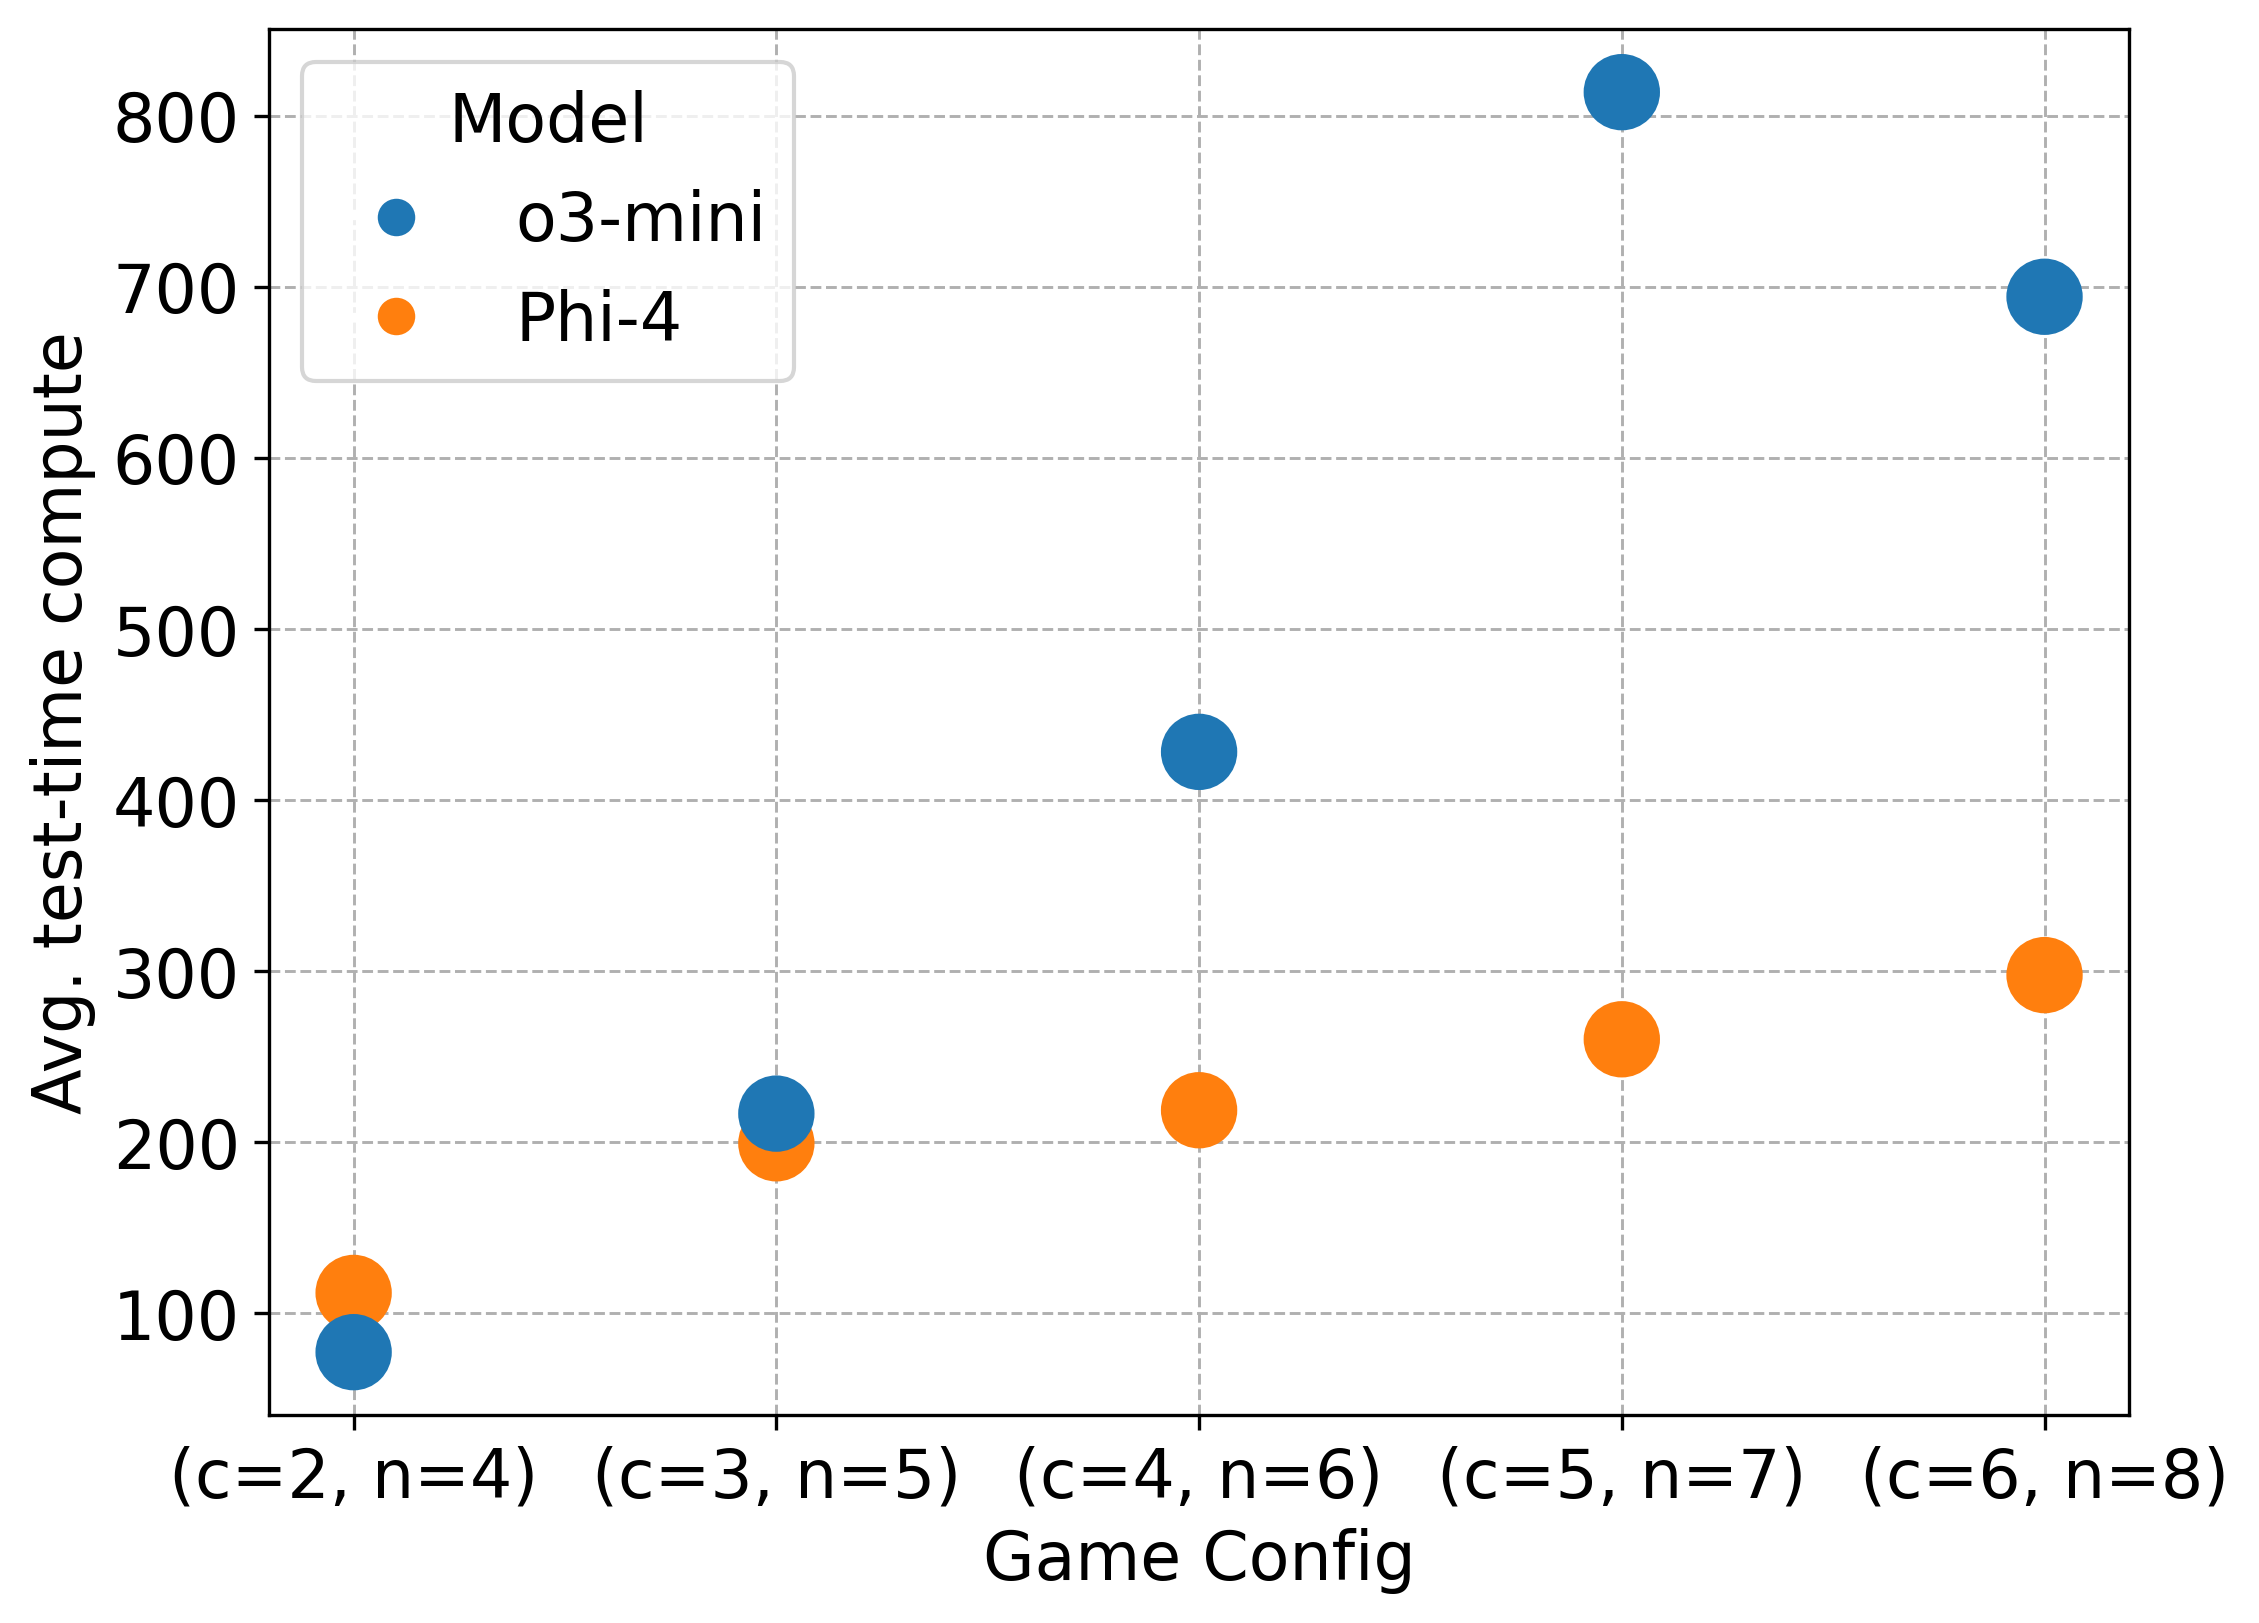
This scatter plot visualizes the relationship between "Game Config" and "Avg. test-time compute" for two different models: "o3-mini" and "Phi-4". The x-axis represents different game configurations, and the y-axis represents the average test-time compute. Each point on the plot represents a specific game configuration and model combination.
### Components/Axes
* **X-axis:** "Game Config" with markers (c=2, n=4), (c=3, n=5), (c=4, n=6), (c=5, n=7), (c=6, n=8).
* **Y-axis:** "Avg. test-time compute" ranging from 0 to 800, with increments of 100.
* **Legend:** Located in the top-left corner, identifying the models:
* "o3-mini" (represented by blue circles)
* "Phi-4" (represented by orange circles)
### Detailed Analysis
The plot contains data points for both models across the five game configurations.
**o3-mini (Blue Circles):**
* **(c=2, n=4):** Approximately 100.
* **(c=3, n=5):** Approximately 230.
* **(c=4, n=6):** Approximately 440.
* **(c=5, n=7):** Approximately 800.
* **(c=6, n=8):** Approximately 700.
The trend for o3-mini is initially upward, increasing rapidly from (c=2, n=4) to (c=5, n=7), then decreasing slightly at (c=6, n=8).
**Phi-4 (Orange Circles):**
* **(c=2, n=4):** Approximately 180.
* **(c=3, n=5):** Approximately 210.
* **(c=4, n=6):** Approximately 270.
* **(c=5, n=7):** Approximately 280.
* **(c=6, n=8):** Approximately 310.
The trend for Phi-4 is consistently upward, but with a decreasing rate of increase as the game configuration increases.
### Key Observations
* The "o3-mini" model generally requires significantly more compute time than "Phi-4" for the lower game configurations (c=2, n=4 and c=3, n=5).
* At the highest game configuration (c=6, n=8), the compute time for "o3-mini" decreases, while "Phi-4" continues to increase, narrowing the gap.
* The rate of increase in compute time for "Phi-4" is relatively consistent across all game configurations.
* The compute time for "o3-mini" shows a peak at (c=5, n=7).
### Interpretation
The data suggests that the computational cost of running the "o3-mini" model is highly sensitive to the game configuration, exhibiting a non-linear relationship. The initial rapid increase in compute time for "o3-mini" could be due to the model reaching a complexity limit or encountering performance bottlenecks as the game configuration increases. The subsequent decrease at (c=6, n=8) is unexpected and might indicate optimization or a change in the model's behavior at higher configurations.
"Phi-4", on the other hand, demonstrates a more stable and predictable increase in compute time with increasing game configuration. This suggests that "Phi-4" is less susceptible to the specific characteristics of the game configurations tested.
The difference in compute time between the two models highlights a trade-off between model complexity and computational efficiency. "o3-mini" might offer higher performance in certain scenarios, but at the cost of increased compute requirements, especially for more complex game configurations. "Phi-4" provides a more consistent and potentially more scalable solution, albeit with potentially lower peak performance. The peak at (c=5, n=7) for o3-mini is an anomaly that warrants further investigation. It could be a result of a specific interaction between the model and that particular game configuration.