## Scatter Plot: Average Test-Time Compute by Game Configuration and Model
### Overview
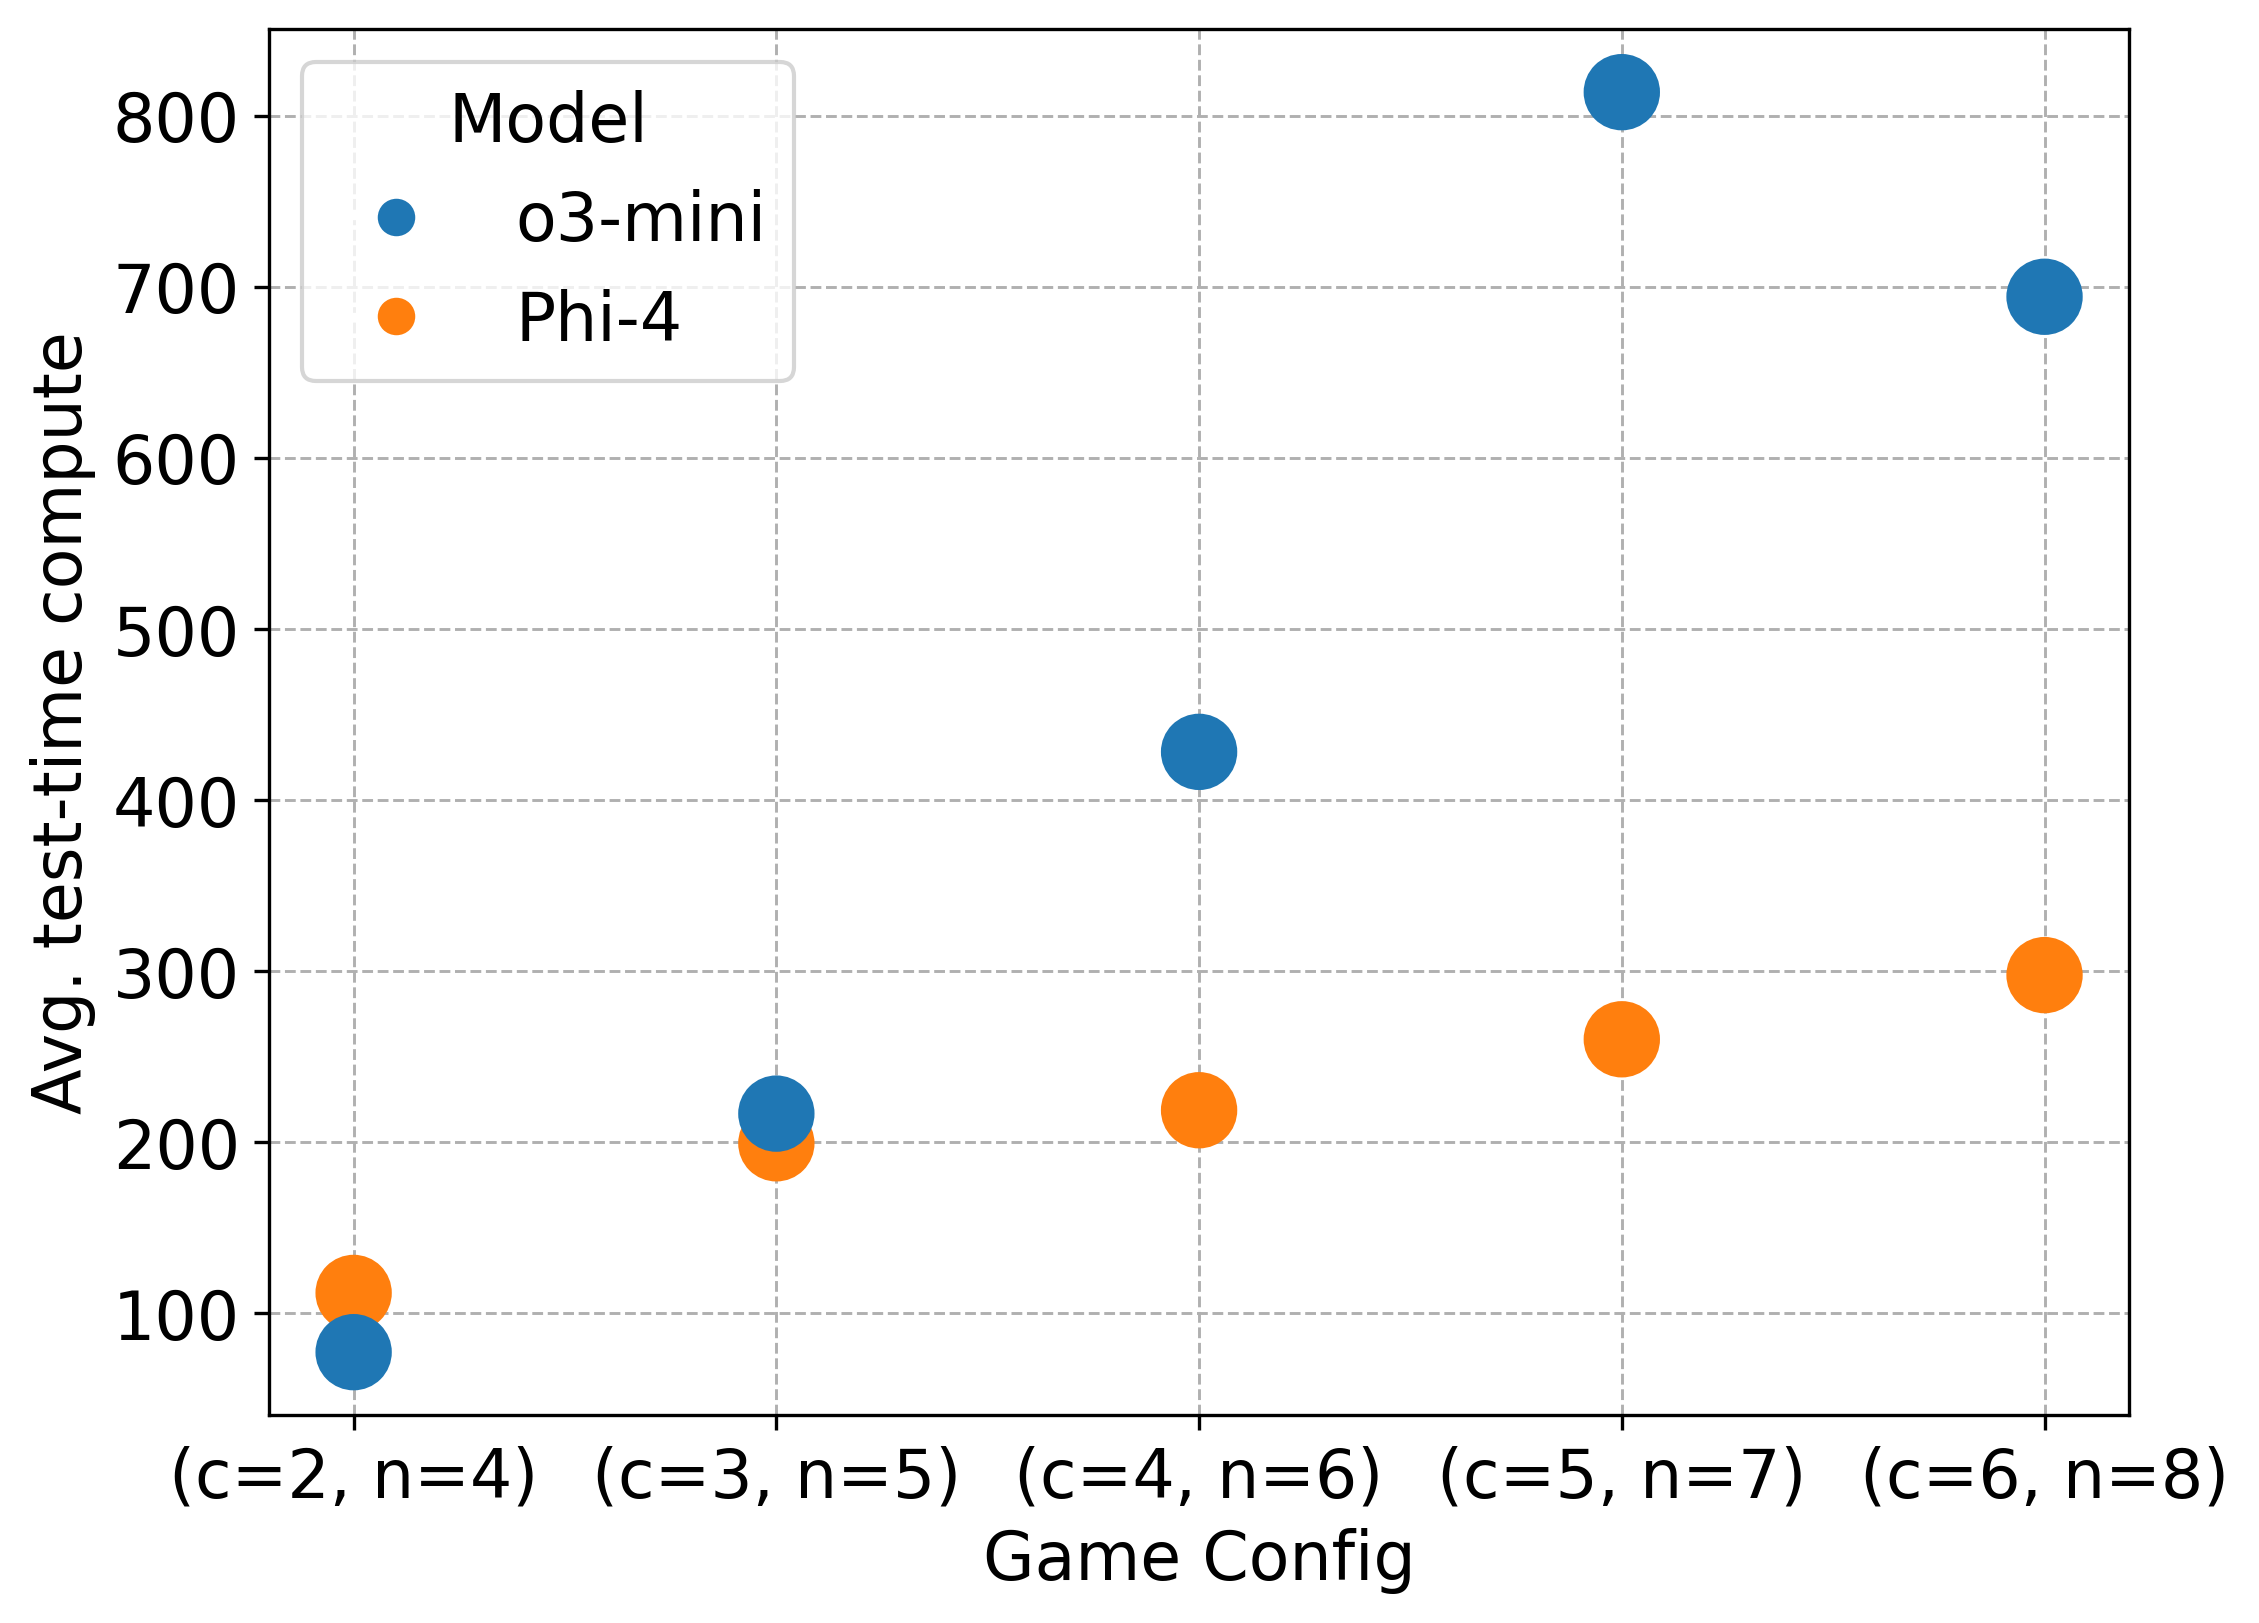
The image is a scatter plot comparing the average test-time compute (y-axis) for two models, **o3-mini** (blue) and **Phi-4** (orange), across five game configurations (x-axis). The x-axis labels represent tuples of parameters `(c, n)`, where `c` and `n` are integers. The y-axis ranges from 0 to 800, with gridlines for reference.
---
### Components/Axes
- **X-axis (Game Config)**:
- Labels: `(c=2, n=4)`, `(c=3, n=5)`, `(c=4, n=6)`, `(c=5, n=7)`, `(c=6, n=8)`
- Position: Bottom of the plot, centered below each data point.
- **Y-axis (Avg. test-time compute)**:
- Range: 0 to 800, with increments of 100.
- Position: Left side of the plot.
- **Legend**:
- Located in the top-left corner.
- Labels:
- **o3-mini** (blue circle)
- **Phi-4** (orange circle)
---
### Detailed Analysis
#### Data Points (approximate values with uncertainty):
1. **(c=2, n=4)**:
- o3-mini: ~80
- Phi-4: ~120
2. **(c=3, n=5)**:
- o3-mini: ~220
- Phi-4: ~200
3. **(c=4, n=6)**:
- o3-mini: ~430
- Phi-4: ~220
4. **(c=5, n=7)**:
- o3-mini: ~820 (outlier, significantly higher than other points)
- Phi-4: ~260
5. **(c=6, n=8)**:
- o3-mini: ~700
- Phi-4: ~300
#### Trends:
- **o3-mini** (blue):
- Shows a **non-linear increase** in test-time compute as `c` and `n` increase.
- The largest jump occurs at `(c=5, n=7)`, where the value spikes to ~820, far exceeding other configurations.
- At `(c=6, n=8)`, the value drops slightly to ~700, suggesting a possible anomaly or optimization.
- **Phi-4** (orange):
- Exhibits a **gradual, linear increase** across configurations.
- Values remain consistently lower than o3-mini, with no outliers.
---
### Key Observations
1. **o3-mini** demonstrates **higher computational demands** compared to Phi-4, particularly at higher configurations.
2. The **outlier at (c=5, n=7)** for o3-mini (~820) is **~2.5x higher** than its value at `(c=6, n=8)` (~700), indicating a potential inconsistency or unique behavior in that configuration.
3. **Phi-4** maintains a **steady, predictable scaling** with increasing `c` and `n`, suggesting more efficient resource utilization.
---
### Interpretation
The data suggests that **o3-mini** is more computationally intensive than Phi-4, with performance scaling disproportionately at higher configurations. The spike at `(c=5, n=7)` for o3-mini could indicate:
- A **bug or inefficiency** in that specific configuration.
- A **deliberate optimization** for that case, though the subsequent drop at `(c=6, n=8)` contradicts this.
- **Phi-4**’s linear scaling implies better algorithmic efficiency, making it more suitable for configurations with larger `c` and `n`.
The plot highlights the importance of **model-specific optimization** for game configurations, as o3-mini’s performance varies unpredictably compared to Phi-4’s consistent behavior.