# Technical Workflow Diagram Analysis
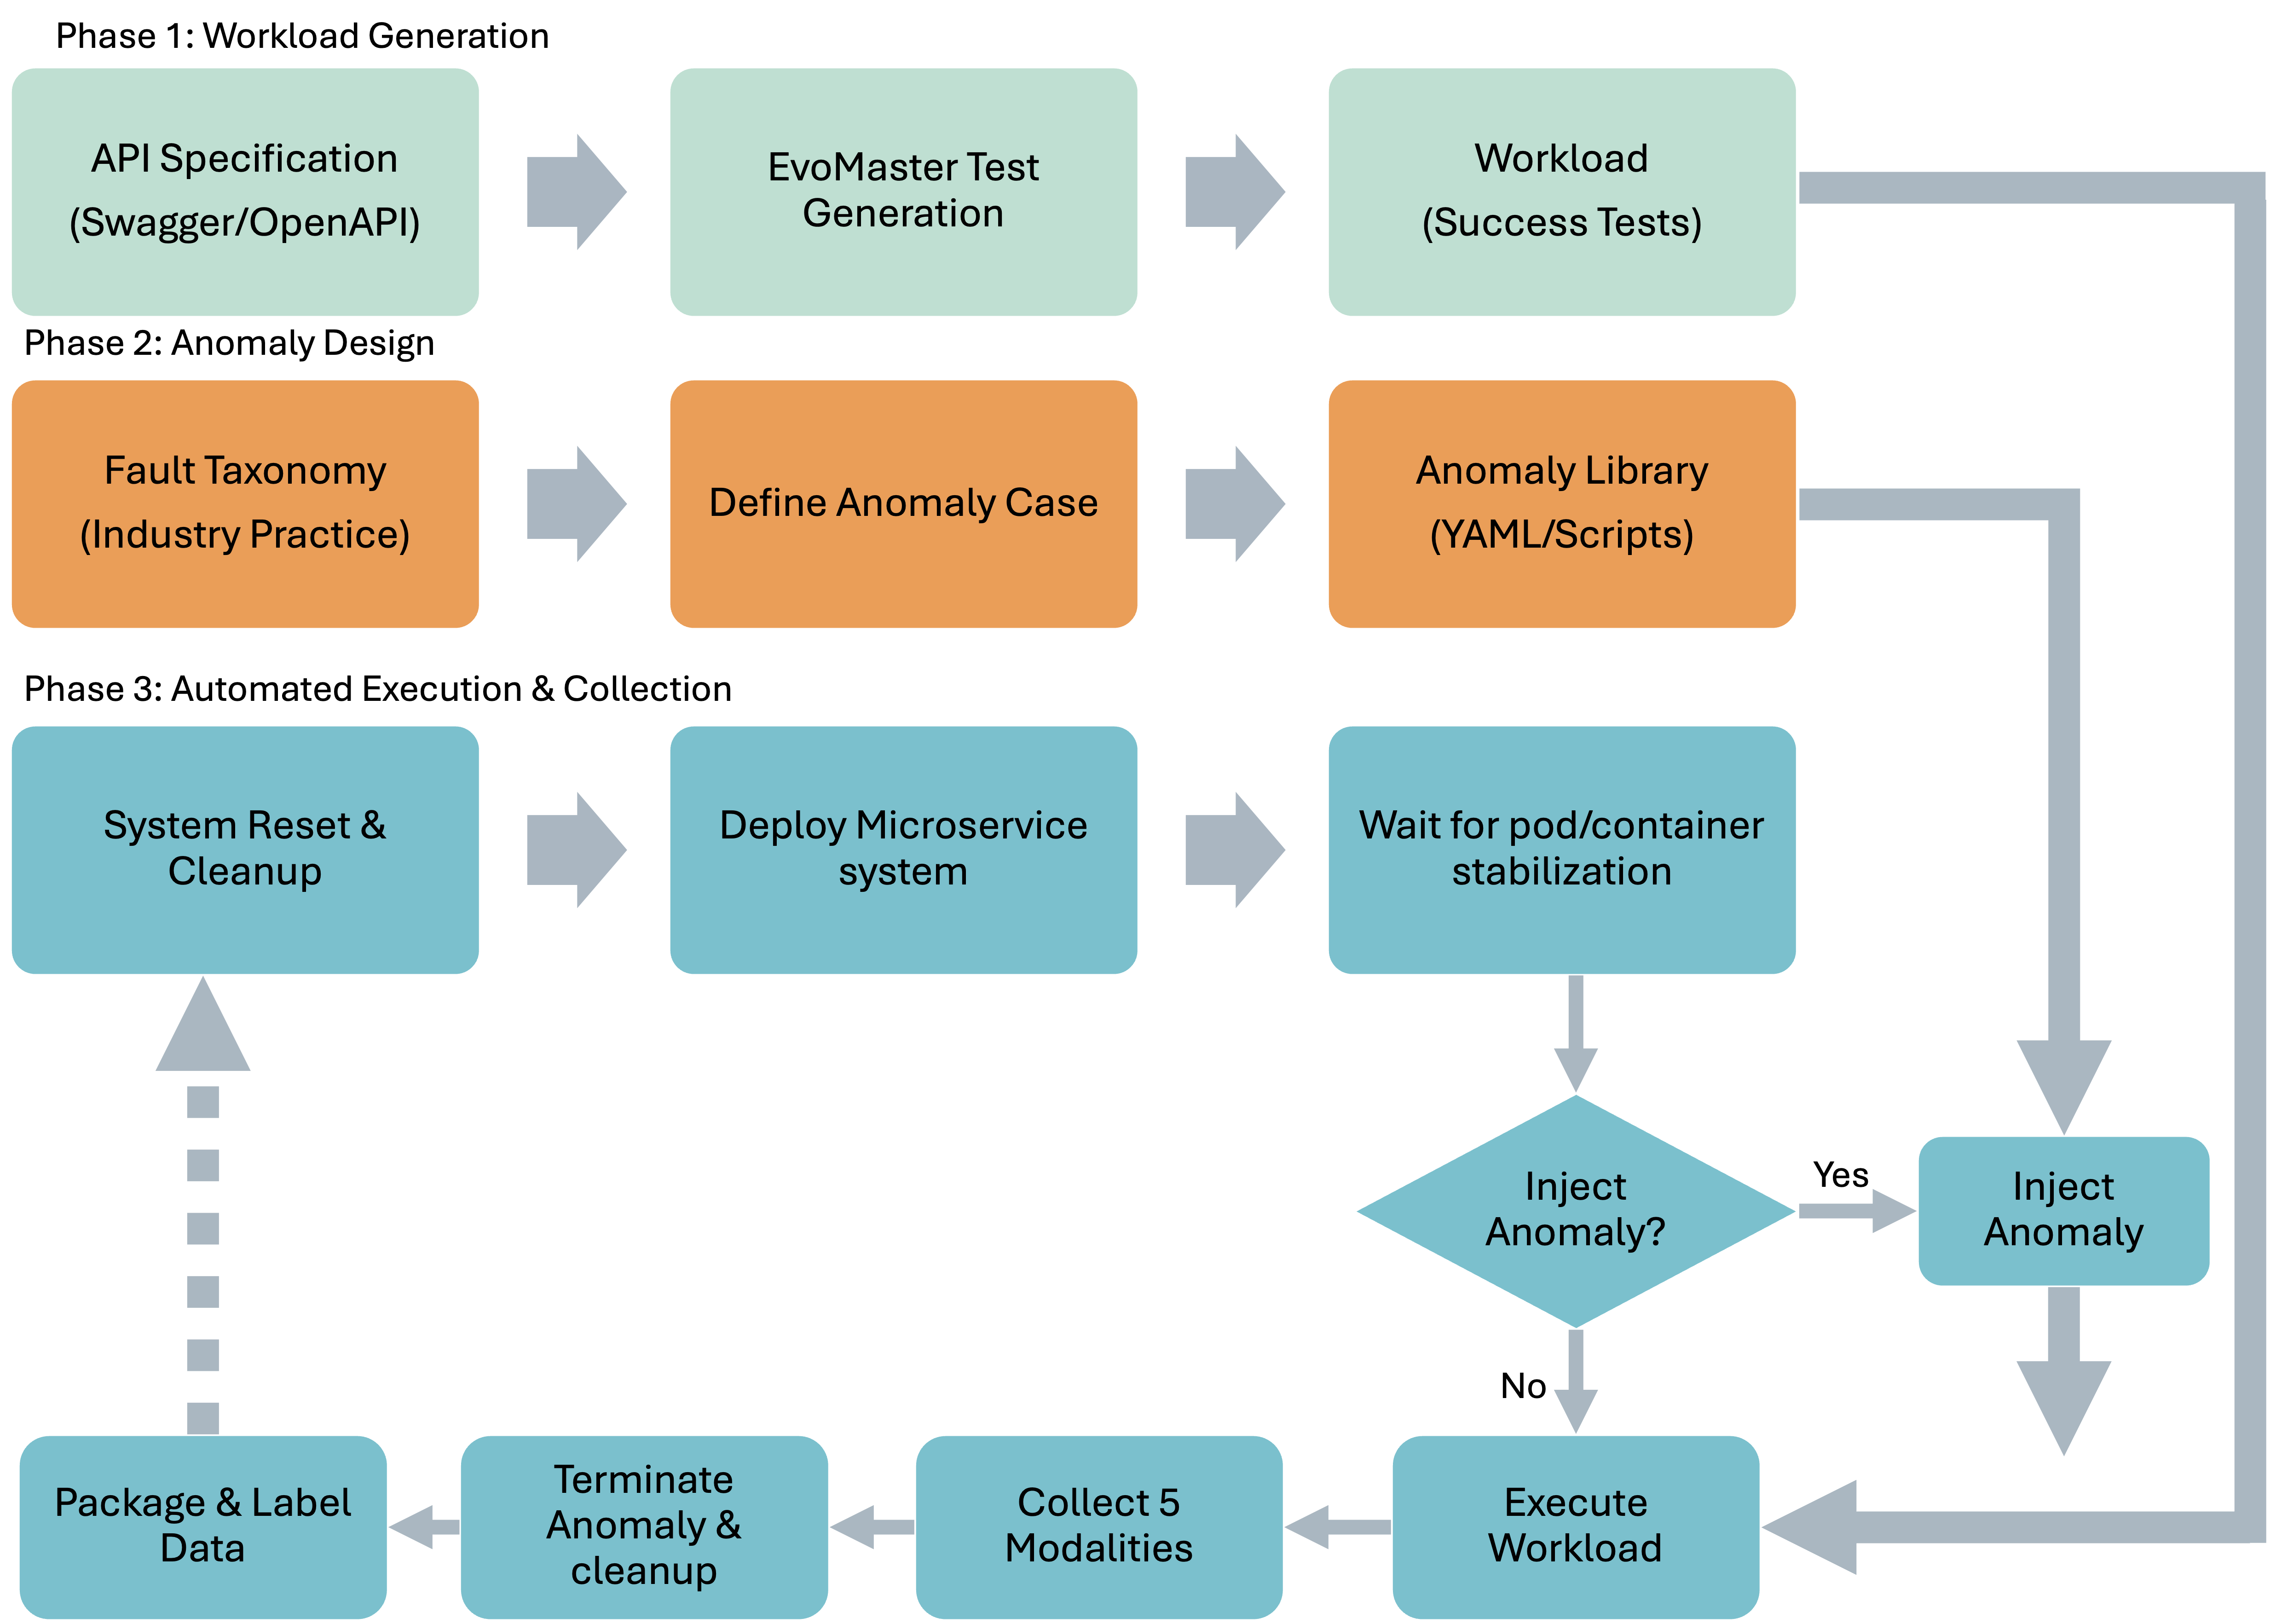
## Phase 1: Workload Generation
1. **API Specification**
- Sub-label: `(Swagger/OpenAPI)`
2. **EvoMaster Test Generation**
3. **Workload**
- Sub-label: `(Success Tests)`
## Phase 2: Anomaly Design
1. **Fault Taxonomy**
- Sub-label: `(Industry Practice)`
2. **Define Anomaly Case**
3. **Anomaly Library**
- Sub-label: `(YAML/Scripts)`
## Phase 3: Automated Execution & Collection
1. **System Reset & Cleanup**
2. **Deploy Microservice system**
3. **Wait for pod/container stabilization**
4. **Inject Anomaly?**
- Decision diamond with two paths:
- **Yes** → **Inject Anomaly**
- **No** → **Execute Workload**
5. **Execute Workload**
6. **Collect 5 Modalities**
## Feedback Loops
1. **Dashed Arrow Path**
- **Collect 5 Modalities** → **System Reset & Cleanup** (iterative cycle)
2. **Conditional Path**
- **Inject Anomaly?** → **Inject Anomaly** (loop until resolved)
## Key Connections
- **Solid Arrows**: Sequential workflow progression
- **Dashed Arrows**: Optional/iterative steps
- **Decision Diamond**: Conditional branching logic
## Textual Elements
- All labels are explicitly annotated within boxes or decision diamonds.
- No axis titles, legends, or numerical data present (purely procedural flowchart).
- Sub-labels in parentheses clarify technical specifics (e.g., `Swagger/OpenAPI`, `YAML/Scripts`).
This extraction captures all textual components, flow logic, and structural relationships in the diagram. The flowchart represents a cyclical testing process with conditional anomaly injection and iterative system cleanup.