\n
## Scatter Plot Matrix: Correlation Analysis of LLM Scores
### Overview
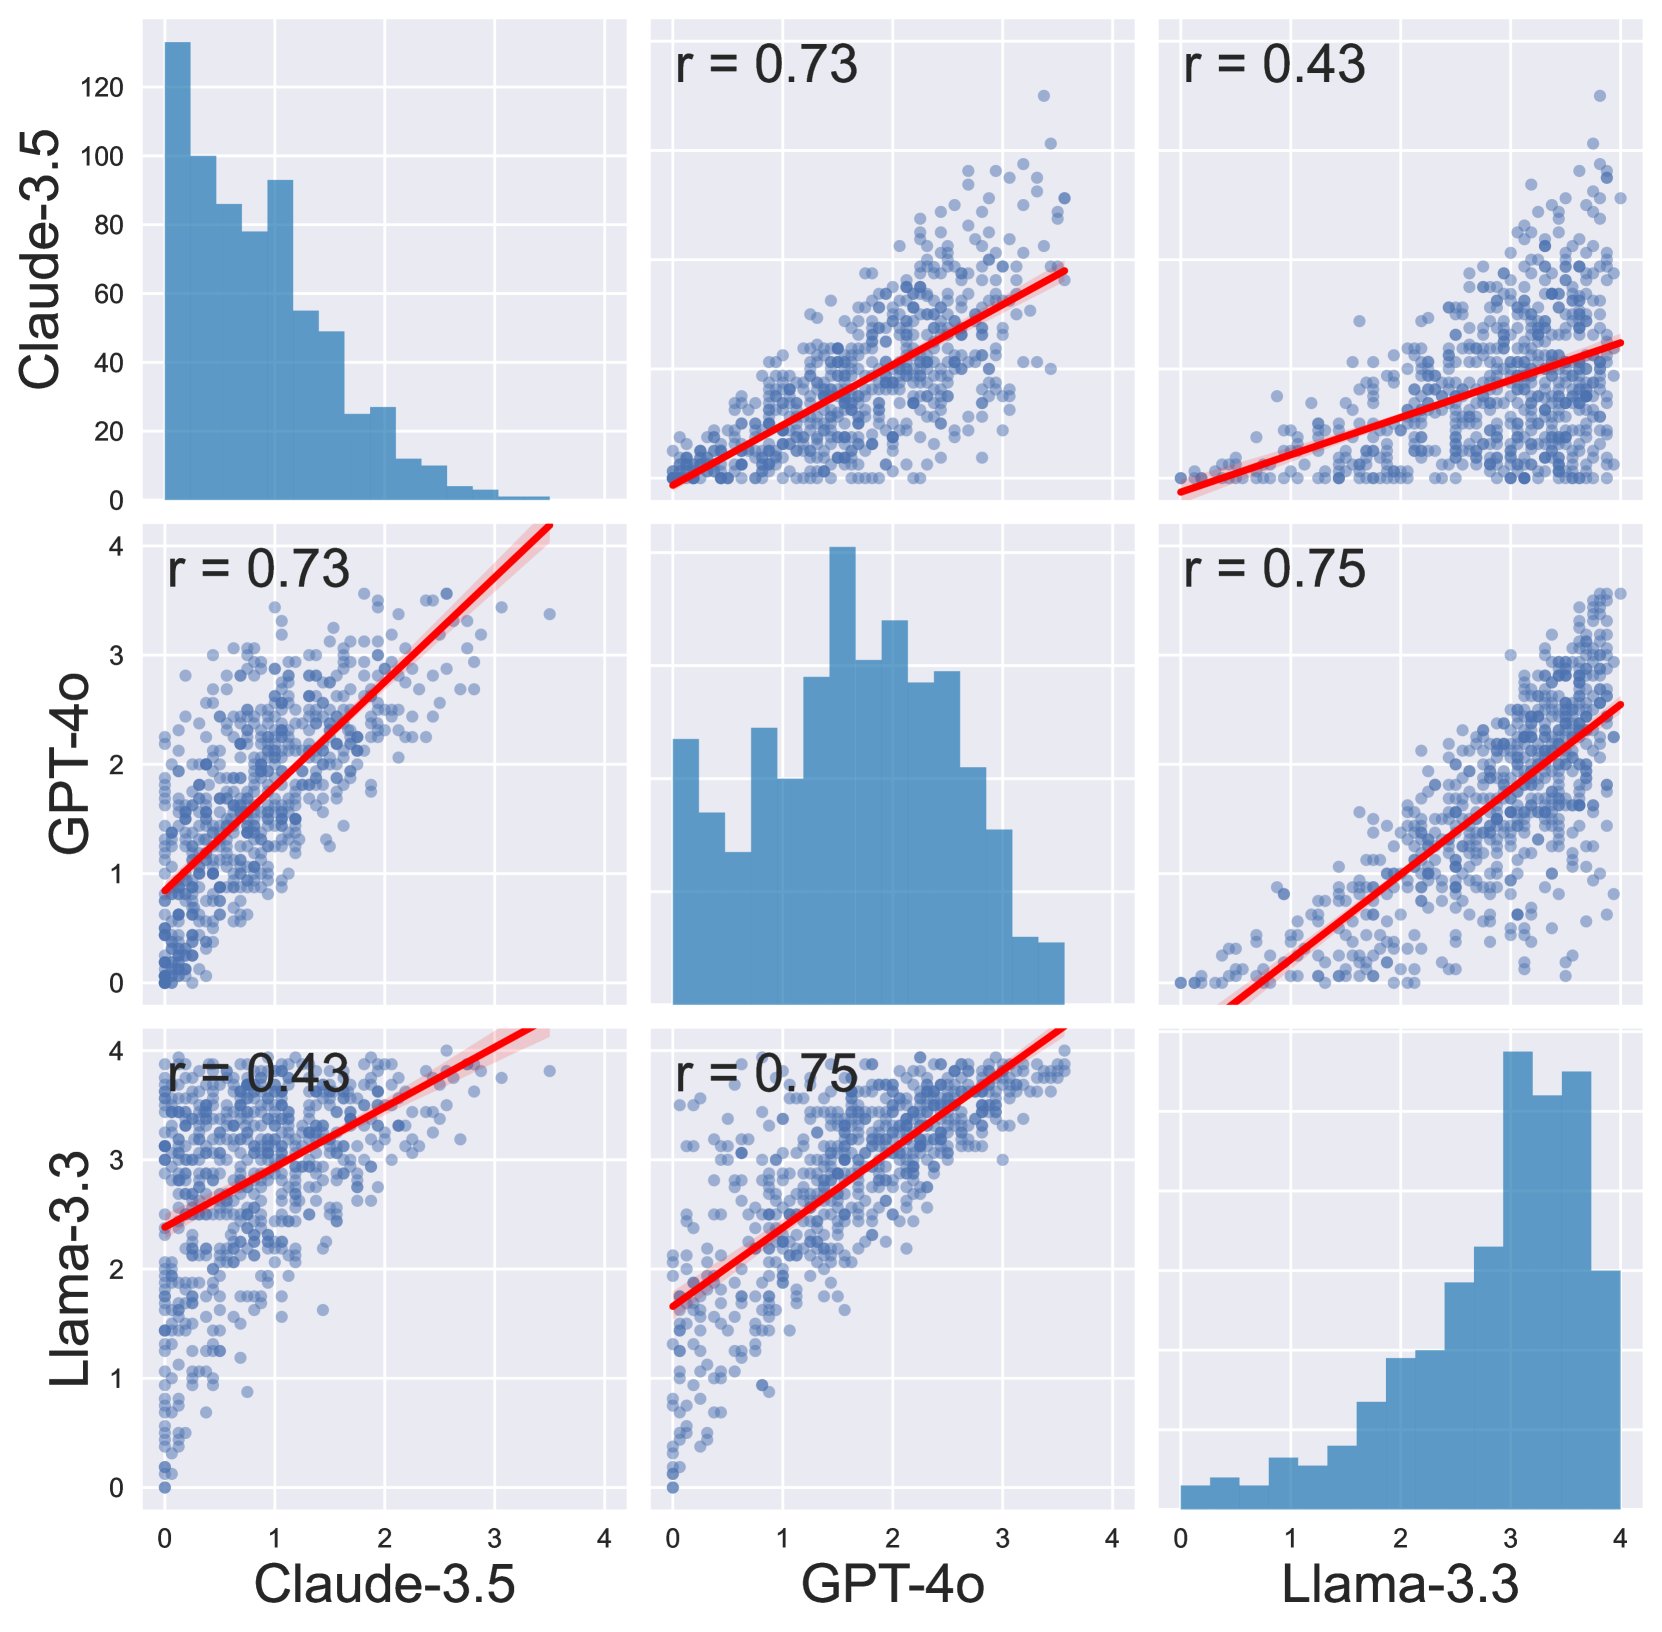
This image presents a scatter plot matrix displaying the correlations between three Large Language Models (LLMs): Claude-3.5, GPT-4o, and Llama-3.3. Each off-diagonal plot shows the relationship between two models, with a regression line indicating the trend. The diagonal plots display histograms of each model's score distribution. Pearson correlation coefficients (r) are provided for each pairwise comparison.
### Components/Axes
* **Axes Labels:** The x and y axes of each scatter plot are labeled with the names of the LLMs being compared (Claude-3.5, GPT-4o, Llama-3.3).
* **Histograms:** The diagonal plots show histograms with the LLM name on the y-axis and score on the x-axis, ranging from approximately 0 to 120 for Claude-3.5, 0 to 4 for GPT-4o, and 0 to 4 for Llama-3.3.
* **Scatter Plots:** Each off-diagonal plot displays the scores of two LLMs as points.
* **Regression Lines:** A red line of best fit is drawn through each scatter plot, indicating the linear relationship between the two models.
* **Correlation Coefficients:** The Pearson correlation coefficient (r) is displayed above each off-diagonal scatter plot.
* **Gridlines:** A light grid is present in the background of each plot.
### Detailed Analysis or Content Details
**1. Claude-3.5 vs. GPT-4o (Top-Left):**
* Trend: The scatter plot shows a positive, but somewhat scattered, linear trend.
* Correlation Coefficient (r): 0.73
* X-axis (Claude-3.5): Range approximately 0 to 4.
* Y-axis (GPT-4o): Range approximately 0 to 3.
* Histogram (Claude-3.5): The distribution is right-skewed, with a peak around 1.5-2.0 and a tail extending to approximately 120.
**2. Claude-3.5 vs. Llama-3.3 (Top-Right):**
* Trend: The scatter plot shows a weak positive linear trend.
* Correlation Coefficient (r): 0.43
* X-axis (Claude-3.5): Range approximately 0 to 4.
* Y-axis (Llama-3.3): Range approximately 0 to 3.
* Histogram (Llama-3.3): The distribution is roughly uniform, with values ranging from 0 to 4.
**3. GPT-4o vs. Claude-3.5 (Center-Left):**
* Trend: The scatter plot shows a positive, but somewhat scattered, linear trend.
* Correlation Coefficient (r): 0.73
* X-axis (GPT-4o): Range approximately 0 to 4.
* Y-axis (Claude-3.5): Range approximately 0 to 3.
* Histogram (GPT-4o): The distribution is roughly uniform, with values ranging from 0 to 4.
**4. GPT-4o vs. Llama-3.3 (Center):**
* Trend: The scatter plot shows a strong positive linear trend.
* Correlation Coefficient (r): 0.75
* X-axis (GPT-4o): Range approximately 0 to 4.
* Y-axis (Llama-3.3): Range approximately 0 to 3.
* Histogram (GPT-4o): The distribution is roughly uniform, with values ranging from 0 to 4.
**5. Llama-3.3 vs. Claude-3.5 (Bottom-Left):**
* Trend: The scatter plot shows a weak positive linear trend.
* Correlation Coefficient (r): 0.43
* X-axis (Llama-3.3): Range approximately 0 to 4.
* Y-axis (Claude-3.5): Range approximately 0 to 3.
* Histogram (Claude-3.5): The distribution is right-skewed, with a peak around 1.5-2.0 and a tail extending to approximately 120.
**6. Llama-3.3 vs. GPT-4o (Bottom-Right):**
* Trend: The scatter plot shows a strong positive linear trend.
* Correlation Coefficient (r): 0.75
* X-axis (Llama-3.3): Range approximately 0 to 4.
* Y-axis (GPT-4o): Range approximately 0 to 3.
* Histogram (Llama-3.3): The distribution is roughly uniform, with values ranging from 0 to 4.
### Key Observations
* The strongest correlations are observed between GPT-4o and Llama-3.3 (r = 0.75) and between Claude-3.5 and GPT-4o (r = 0.73).
* The weakest correlation is between Claude-3.5 and Llama-3.3 (r = 0.43).
* Claude-3.5 has a significantly wider score range and a right-skewed distribution compared to GPT-4o and Llama-3.3, which have more uniform distributions.
### Interpretation
The scatter plot matrix reveals the degree of agreement between the three LLMs. The high correlation between GPT-4o and Llama-3.3 suggests that these models tend to assign similar scores to the same inputs. The moderate correlation between Claude-3.5 and GPT-4o indicates a reasonable level of agreement, but with more variability. The low correlation between Claude-3.5 and Llama-3.3 suggests that these two models may evaluate inputs differently.
The differing distributions of scores for Claude-3.5, with its right skew, suggests that it is more likely to assign very high scores than GPT-4o or Llama-3.3. This could indicate that Claude-3.5 is more sensitive to certain types of inputs or has a different scoring scale. The more uniform distributions of GPT-4o and Llama-3.3 suggest a more consistent scoring approach.
The data suggests that while all three models are related, they are not perfectly aligned in their evaluations. This highlights the importance of considering multiple LLMs when assessing the performance of a given task or input. The differences in correlation and distribution could be due to variations in model architecture, training data, or scoring criteria.