## Scatter Plot Matrix: AI Model Performance Correlations
### Overview
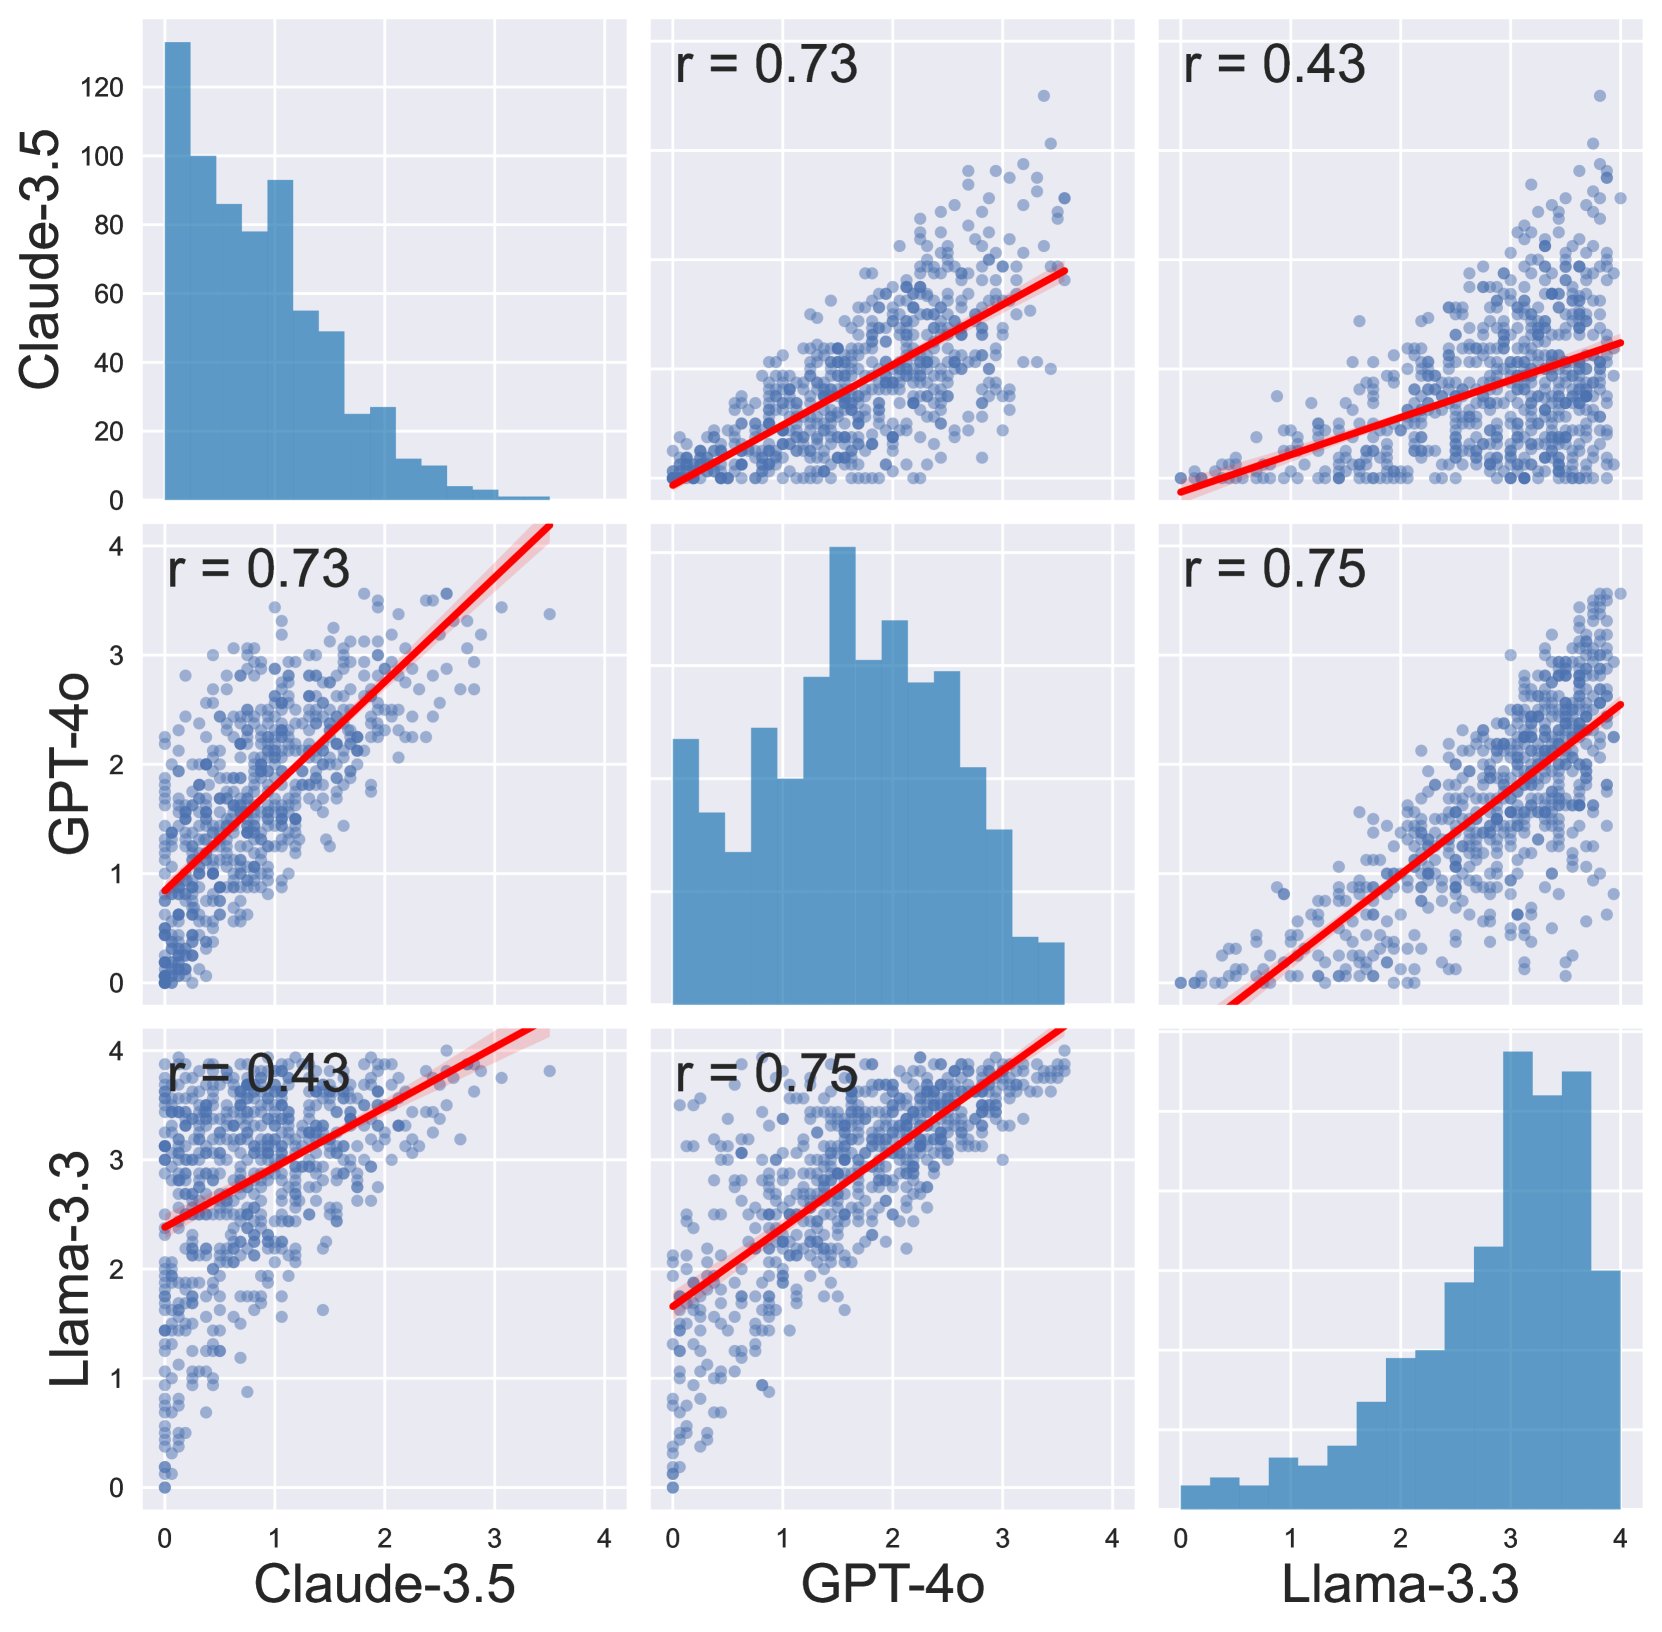
The image is a 3x3 scatter plot matrix (also known as a pairs plot) comparing the performance scores of three large language models: **Claude-3.5**, **GPT-4o**, and **Llama-3.3**. The diagonal panels show histograms of each model's individual score distribution. The off-diagonal panels are scatter plots showing the pairwise correlation between models, each overlaid with a red linear regression line and a shaded confidence interval. The correlation coefficient (Pearson's r) is displayed in the top-left corner of each scatter plot.
### Components/Axes
* **Matrix Structure:** A 3x3 grid.
* **Row Labels (Y-axes):** From top to bottom: "Claude-3.5", "GPT-4o", "Llama-3.3".
* **Column Labels (X-axes):** From left to right: "Claude-3.5", "GPT-4o", "Llama-3.3".
* **Diagonal Panels (Histograms):**
* **Top-Left (Claude-3.5):** Histogram of Claude-3.5 scores. Y-axis scale: 0 to 120 (frequency/count). X-axis scale: 0 to 4.
* **Center (GPT-4o):** Histogram of GPT-4o scores. Y-axis scale: not explicitly labeled, but appears to be frequency. X-axis scale: 0 to 4.
* **Bottom-Right (Llama-3.3):** Histogram of Llama-3.3 scores. Y-axis scale: not explicitly labeled. X-axis scale: 0 to 4.
* **Off-Diagonal Panels (Scatter Plots):** Each shows data points as semi-transparent blue dots. A solid red line represents the linear regression fit, surrounded by a light red shaded area indicating the confidence interval.
* **Correlation Coefficients (r values):** Displayed in the top-left corner of each scatter plot panel.
* **Axis Scales:**
* Claude-3.5 axis (both X and Y): Ranges from 0 to 4.
* GPT-4o axis (both X and Y): Ranges from 0 to 4.
* Llama-3.3 axis (both X and Y): Ranges from 0 to 4.
* *Note: The Claude-3.5 histogram's Y-axis (frequency) has a different scale (0-120) than the others.*
### Detailed Analysis
**1. Histograms (Diagonal):**
* **Claude-3.5 (Top-Left):** Distribution is strongly right-skewed. The highest frequency bin is at the lowest score range (0-0.5), with a count of approximately 130. Frequency decreases steadily as scores increase, with very few instances above a score of 3.
* **GPT-4o (Center):** Distribution is roughly symmetric and unimodal, centered around a score of approximately 2. The peak frequency appears to be in the 1.5-2.0 bin.
* **Llama-3.3 (Bottom-Right):** Distribution is left-skewed. The highest frequency bins are at the high end of the scale (3.0-3.5 and 3.5-4.0). Very few instances have scores below 1.
**2. Scatter Plots & Correlations (Off-Diagonal):**
* **Claude-3.5 vs. GPT-4o (Top-Middle & Middle-Left):**
* **Correlation:** r = 0.73 (Strong positive correlation).
* **Trend:** The red regression line slopes steeply upward from left to right.
* **Data Spread:** Points are moderately clustered around the line. There is a visible cloud of points where Claude-3.5 scores are low (0-2) and GPT-4o scores are moderate (1-3).
* **Claude-3.5 vs. Llama-3.3 (Top-Right & Bottom-Left):**
* **Correlation:** r = 0.43 (Moderate positive correlation).
* **Trend:** The red regression line slopes upward, but with a shallower slope than the Claude/GPT plot.
* **Data Spread:** Points are more widely scattered. A notable cluster exists where Claude-3.5 scores are low (0-1) and Llama-3.3 scores are high (3-4), contributing to the weaker correlation.
* **GPT-4o vs. Llama-3.3 (Middle-Right & Bottom-Center):**
* **Correlation:** r = 0.75 (Strong positive correlation).
* **Trend:** The red regression line slopes steeply upward.
* **Data Spread:** Points are relatively tightly clustered around the regression line, indicating a consistent relationship. When GPT-4o scores are low, Llama-3.3 scores tend to be low, and when GPT-4o scores are high, Llama-3.3 scores tend to be high.
### Key Observations
1. **Divergent Score Distributions:** The three models have fundamentally different performance profiles on this evaluation. Claude-3.5 tends to receive low scores, GPT-4o scores are centered in the middle, and Llama-3.3 tends to receive high scores.
2. **Strongest Correlation:** The strongest pairwise relationship (r=0.75) is between **GPT-4o and Llama-3.3**. Their performance rankings are most similar.
3. **Weakest Correlation:** The weakest relationship (r=0.43) is between **Claude-3.5 and Llama-3.3**. Their performance rankings are the least aligned, with many cases where one model scores low and the other scores high.
4. **Claude-3.5 as an Outlier:** The distribution and correlation patterns suggest Claude-3.5's performance is driven by different factors than GPT-4o and Llama-3.3, which appear more aligned with each other.
### Interpretation
This matrix reveals the comparative behavior of three AI models on a common evaluation set. The data suggests that **GPT-4o and Llama-3.3 are "aligned" in their relative strengths and weaknesses**—they tend to succeed and fail on similar tasks, as evidenced by their high correlation and similar (though not identical) score distributions. In contrast, **Claude-3.5 exhibits a distinct performance signature**. Its right-skewed histogram indicates it often receives low scores, but its weaker correlations with the other models show that its pattern of success/failure is less predictable from theirs.
The high frequency of low scores for Claude-3.5 could indicate it is being evaluated on a task set that is particularly challenging for its architecture or training, or that it adopts a different response strategy that is penalized by this specific scoring rubric. The strong GPT-4o/Llama-3.3 correlation might reflect shared training data, similar model architectures, or alignment to similar human preference signals. This analysis is crucial for understanding model complementarity; for instance, an ensemble system might benefit from combining Claude-3.5 with one of the other models to cover a wider range of task types.