## Scatter Plot Matrix: Model Performance Correlation Analysis
### Overview
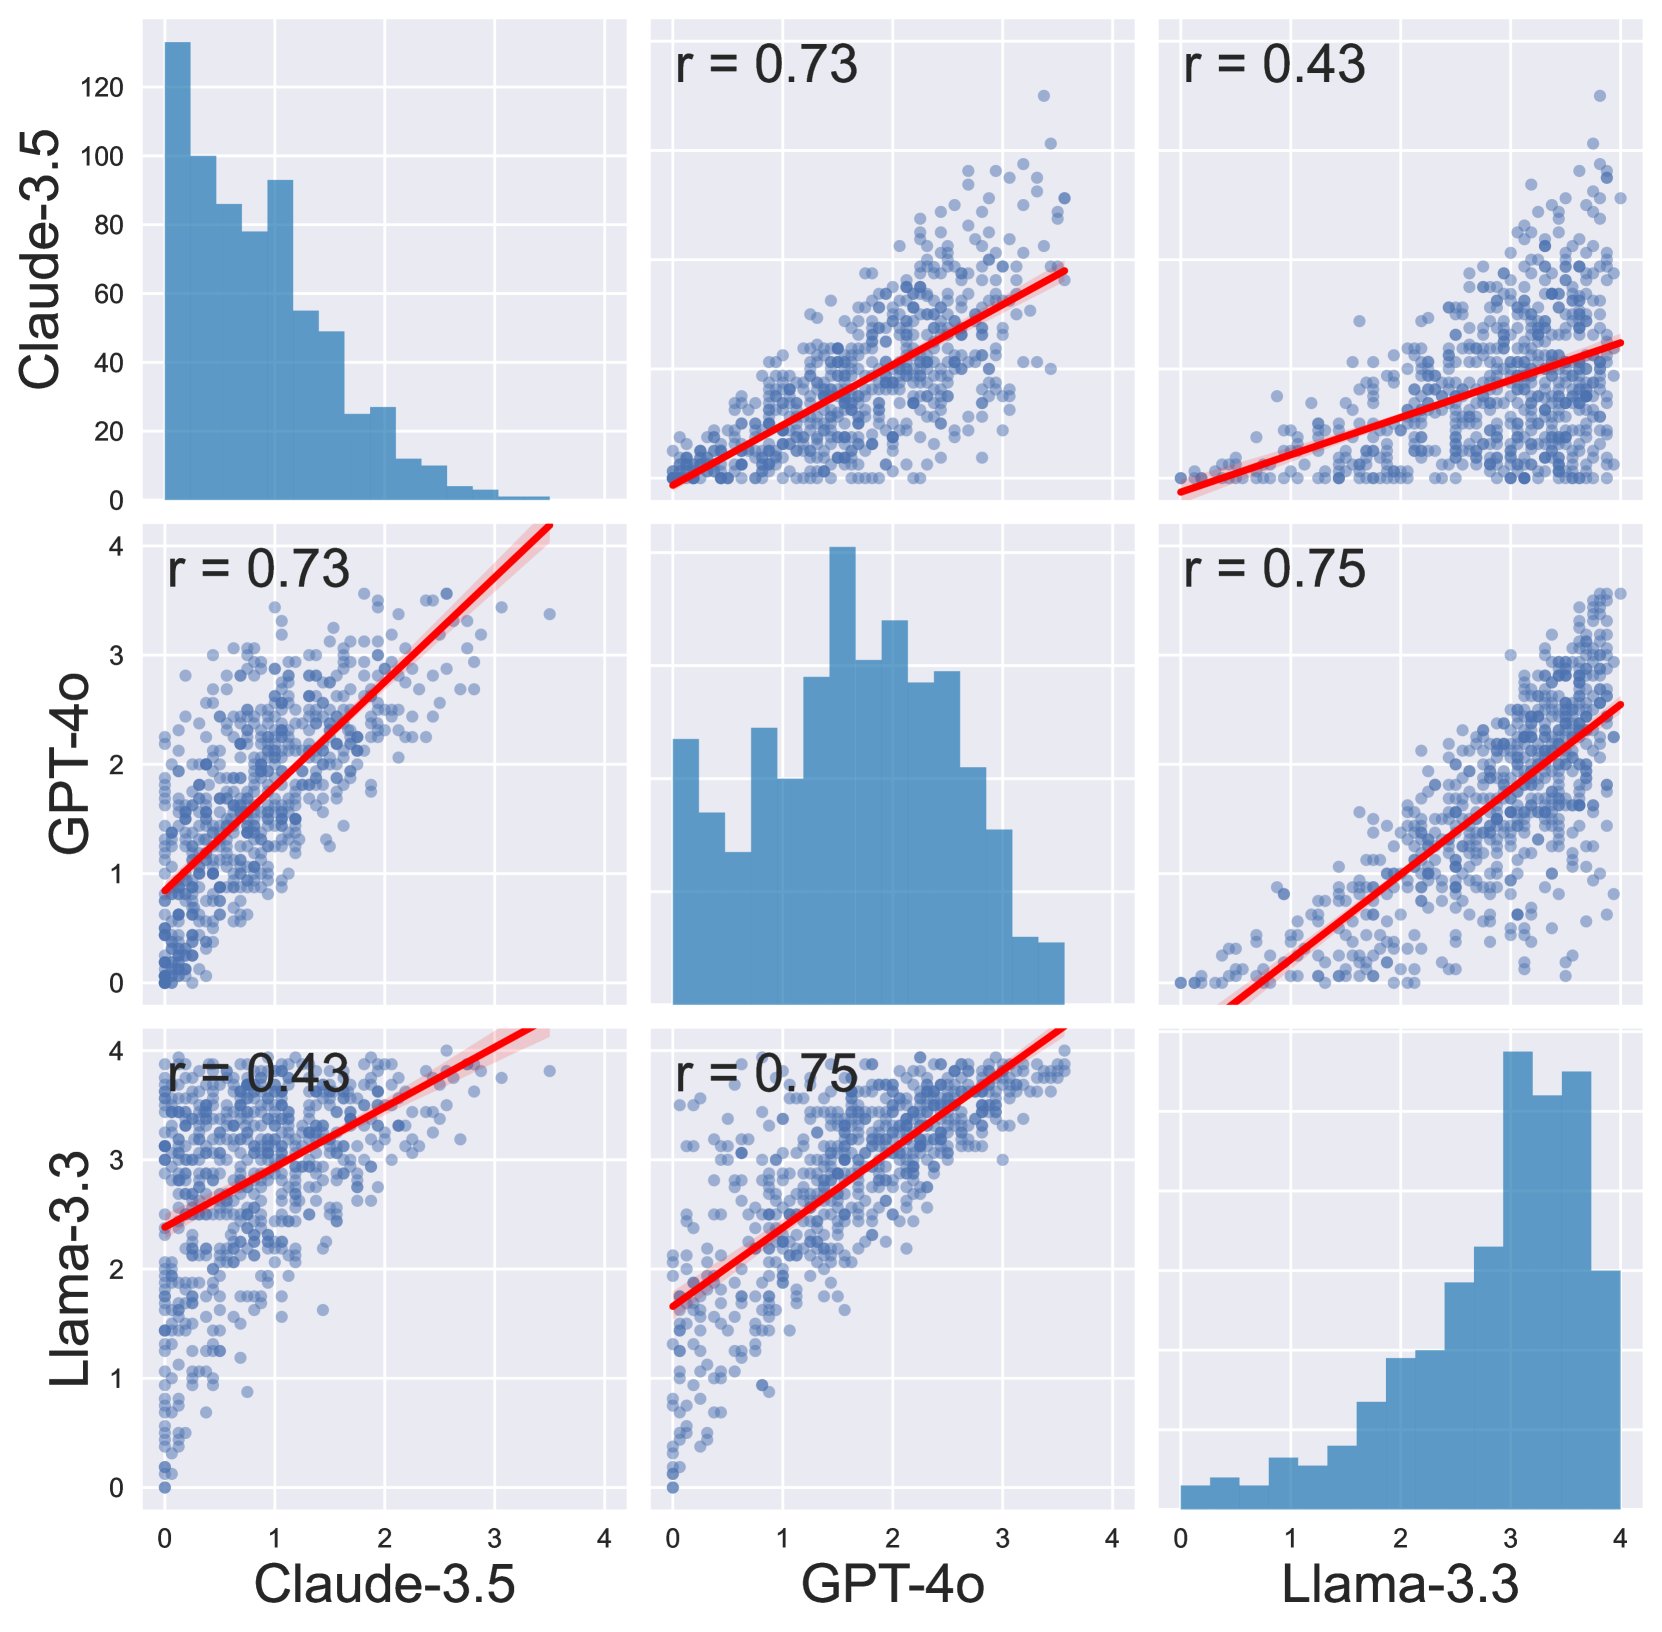
A 3x3 grid of comparative visualizations analyzing relationships between three AI models: Claude-3.5, GPT-4o, and Llama-3.3. Each row represents a primary model, with columns showing: 1) Univariate distribution histogram, 2) Bivariate scatter plot with trend line, and 3) Secondary univariate distribution histogram.
### Components/Axes
**Row 1 (Claude-3.5):**
- Left: Histogram (y-axis: Claude-3.5 scores, x-axis: 0-4 scale)
- Middle: Scatter plot (x: Claude-3.5 vs y: GPT-4o, r=0.73)
- Right: Histogram (y-axis: Claude-3.5 scores, x-axis: 0-4 scale)
**Row 2 (GPT-4o):**
- Left: Histogram (y-axis: GPT-4o scores, x-axis: 0-4 scale)
- Middle: Scatter plot (x: GPT-4o vs y: Llama-3.3, r=0.75)
- Right: Histogram (y-axis: GPT-4o scores, x-axis: 0-4 scale)
**Row 3 (Llama-3.3):**
- Left: Histogram (y-axis: Llama-3.3 scores, x-axis: 0-4 scale)
- Middle: Scatter plot (x: Llama-3.3 vs y: Claude-3.5, r=0.43)
- Right: Histogram (y-axis: Llama-3.3 scores, x-axis: 0-4 scale)
**Legend:** Red trend lines indicate linear regression fits
### Detailed Analysis
**Histograms:**
- All histograms show unimodal distributions with peaks near 3.0-3.5
- Left histograms (Row 1-3) show left-skewed distributions
- Right histograms show right-skewed distributions
- X-axis scale consistently 0-4 across all histograms
**Scatter Plots:**
1. Claude-3.5 vs GPT-4o (r=0.73):
- Strong positive correlation
- Data points tightly clustered around red trend line
- Slope: ~0.85 (estimated from visual inspection)
2. GPT-4o vs Llama-3.3 (r=0.75):
- Very strong positive correlation
- Data points form near-perfect linear pattern
- Slope: ~1.0 (approximate 1:1 relationship)
3. Llama-3.3 vs Claude-3.5 (r=0.43):
- Weak positive correlation
- Data points show significant dispersion
- Slope: ~0.5 (estimated)
### Key Observations
1. **Model Pair Relationships:**
- Claude-3.5 and GPT-4o show strongest correlation (r=0.73)
- GPT-4o and Llama-3.3 demonstrate near-perfect alignment (r=0.75)
- Llama-3.3 and Claude-3.5 exhibit weakest relationship (r=0.43)
2. **Distribution Patterns:**
- All models show similar central tendency (mean ~3.2)
- Right histograms suggest performance variability increases with higher scores
- Left histograms indicate concentration of lower-performing instances
3. **Trend Line Analysis:**
- Red lines in scatter plots confirm positive relationships
- GPT-4o/Llama-3.3 pair shows most consistent performance alignment
- Claude-3.5/Llama-3.3 relationship shows greatest divergence
### Interpretation
The data suggests:
1. **Performance Similarity:** GPT-4o demonstrates strongest alignment with both other models, particularly Llama-3.3 (r=0.75), indicating comparable capabilities in measured metrics.
2. **Divergence Patterns:** Claude-3.5 shows moderate correlation with GPT-4o but weakest relationship with Llama-3.3, suggesting distinct performance characteristics.
3. **Distribution Implications:** The mirrored histogram patterns (left vs right skewness) may indicate different error profiles or performance distribution characteristics between models.
4. **Correlation Strength:** The near-perfect GPT-4o/Llama-3.3 correlation (r=0.75) implies these models may share similar architectural foundations or training methodologies.
The visual evidence supports conclusions about model performance relationships while highlighting areas of divergence that warrant further investigation into architectural differences or training data variations.