## Heatmap: Performance Comparison of Models
### Overview
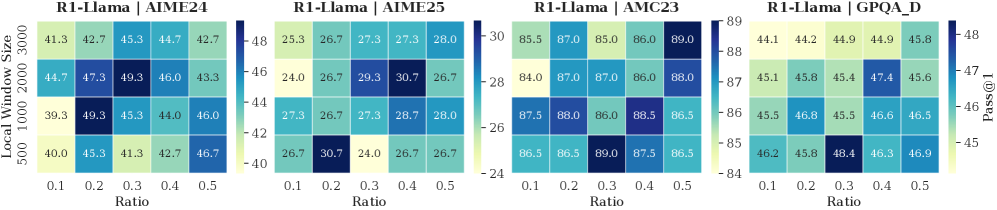
The image presents a heatmap comparing the performance of four different models (R1-Llama | AIME24, R1-Llama | AIME25, R1-Llama | AMC23, and R1-Llama | GPQA D) across varying ratios and local window sizes. The performance metric is "Pass@1", represented by the color intensity.
### Components/Axes
* **X-axis:** Ratio, ranging from 0.1 to 0.5 with increments of 0.1.
* **Y-axis:** Local Window Size, with values of 500, 1000, 2000, and 3000.
* **Color Scale (Right):** Pass@1, ranging from approximately 24 (dark blue) to 89 (dark green).
* **Titles:** Each heatmap is labeled with the model name (e.g., "R1-Llama | AIME24").
* **Layout:** Four heatmaps are arranged horizontally, each representing a different model.
### Detailed Analysis
Each heatmap displays a grid of values corresponding to the combination of Ratio and Local Window Size. The values are color-coded based on the Pass@1 score.
**R1-Llama | AIME24:**
* **Trend:** Generally, performance is relatively stable across ratios for each window size. There's a slight tendency for performance to decrease with increasing ratio at window size 2000.
* **Data Points (approximate):**
* Ratio 0.1, Window 500: 43.7
* Ratio 0.1, Window 1000: 49.3
* Ratio 0.1, Window 2000: 47.3
* Ratio 0.1, Window 3000: 45.3
* Ratio 0.5, Window 500: 42.7
* Ratio 0.5, Window 1000: 46.0
* Ratio 0.5, Window 2000: 43.3
* Ratio 0.5, Window 3000: 46.7
* The lowest value is approximately 42.7, and the highest is approximately 49.3.
**R1-Llama | AIME25:**
* **Trend:** Similar to AIME24, performance is relatively stable. There's a slight dip in performance at Ratio 0.3 and 0.4 for all window sizes.
* **Data Points (approximate):**
* Ratio 0.1, Window 500: 25.3
* Ratio 0.1, Window 1000: 26.7
* Ratio 0.1, Window 2000: 24.0
* Ratio 0.1, Window 3000: 27.3
* Ratio 0.5, Window 500: 26.7
* Ratio 0.5, Window 1000: 30.7
* Ratio 0.5, Window 2000: 26.7
* Ratio 0.5, Window 3000: 28.7
* The lowest value is approximately 24.0, and the highest is approximately 30.7.
**R1-Llama | AMC23:**
* **Trend:** Performance is consistently high across all ratios and window sizes. There's a slight increase in performance with increasing ratio up to 0.4, then a slight decrease.
* **Data Points (approximate):**
* Ratio 0.1, Window 500: 85.5
* Ratio 0.1, Window 1000: 87.0
* Ratio 0.1, Window 2000: 84.0
* Ratio 0.1, Window 3000: 87.5
* Ratio 0.5, Window 500: 86.0
* Ratio 0.5, Window 1000: 86.0
* Ratio 0.5, Window 2000: 86.0
* Ratio 0.5, Window 3000: 86.5
* The lowest value is approximately 84.0, and the highest is approximately 89.0.
**R1-Llama | GPQA D:**
* **Trend:** Performance is generally good, but lower than AMC23. There's a slight increase in performance with increasing ratio up to 0.3, then a slight decrease.
* **Data Points (approximate):**
* Ratio 0.1, Window 500: 44.1
* Ratio 0.1, Window 1000: 45.8
* Ratio 0.1, Window 2000: 45.1
* Ratio 0.1, Window 3000: 44.2
* Ratio 0.5, Window 500: 44.9
* Ratio 0.5, Window 1000: 45.4
* Ratio 0.5, Window 2000: 47.4
* Ratio 0.5, Window 3000: 46.5
* The lowest value is approximately 44.1, and the highest is approximately 47.4.
### Key Observations
* R1-Llama | AMC23 consistently outperforms the other models across all conditions.
* R1-Llama | AIME25 has the lowest overall performance.
* The impact of Local Window Size on performance varies between models.
* The Ratio has a relatively small impact on performance for most models.
### Interpretation
The heatmap demonstrates a clear performance hierarchy among the four models. AMC23 is the most robust, achieving high Pass@1 scores regardless of the ratio or local window size. AIME25 is the least effective. The relatively stable performance across different ratios suggests that the amount of data used for training or inference does not significantly impact the models' ability to pass the tests, within the tested range. The varying impact of local window size indicates that the models' performance is sensitive to the context window, but the specific relationship differs between models. This data could be used to inform model selection and hyperparameter tuning for specific applications. The differences in performance suggest that the underlying architectures or training data of the models are significantly different.