## Heatmap: Performance Metrics Across Models and Datasets
### Overview
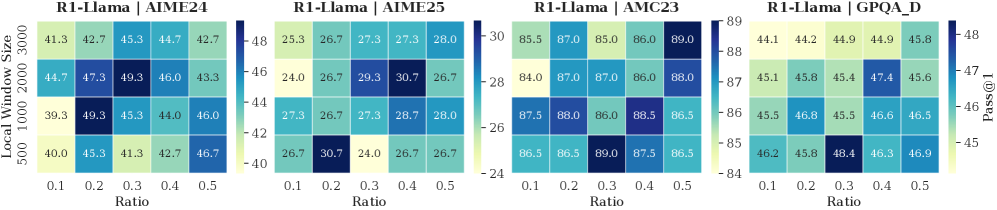
The image displays four heatmaps comparing performance metrics (Pass@1) for the R1-Llama model across different datasets (AIME24, AIME25, AMC23, GPQA_D) under varying **Ratio** (0.1–0.5) and **Local Window Size** (500–3000). Each heatmap uses a color gradient (light to dark) to represent values, with a legend on the right indicating the scale.
### Components/Axes
- **X-axis (Ratio)**: 0.1, 0.2, 0.3, 0.4, 0.5
- **Y-axis (Local Window Size)**: 500, 1000, 2000, 3000
- **Legend**: Color gradient from light (low values) to dark (high values), labeled "Pass@1" with a range of 24–48.
- **Sections**:
1. **R1-Llama | AIME24**
2. **R1-Llama | AIME25**
3. **R1-Llama | AMC23**
4. **R1-Llama | GPQA_D**
### Detailed Analysis
#### R1-Llama | AIME24
- **Values**:
- 500: 41.3, 42.7, 45.3, 44.7, 42.7
- 1000: 39.3, 49.3, 45.3, 44.0, 46.0
- 2000: 44.7, 47.3, 49.3, 46.0, 43.3
- 3000: 40.0, 45.3, 41.3, 42.7, 46.7
- **Trend**: Values peak at **Ratio 0.3** and **Window Size 2000** (49.3).
#### R1-Llama | AIME25
- **Values**:
- 500: 26.7, 30.7, 24.0, 26.7, 26.7
- 1000: 27.3, 26.7, 29.3, 30.7, 26.7
- 2000: 28.7, 27.3, 28.0, 26.7, 26.7
- 3000: 26.7, 26.7, 26.7, 26.7, 26.7
- **Trend**: Highest value at **Ratio 0.3** and **Window Size 1000** (30.7).
#### R1-Llama | AMC23
- **Values**:
- 500: 85.5, 87.0, 87.3, 87.3, 88.0
- 1000: 84.0, 87.0, 86.0, 88.0, 86.0
- 2000: 87.5, 88.0, 86.0, 88.5, 86.5
- 3000: 86.5, 86.5, 89.0, 87.5, 86.5
- **Trend**: Highest value at **Ratio 0.3** and **Window Size 3000** (89.0).
#### R1-Llama | GPQA_D
- **Values**:
- 500: 44.1, 44.9, 44.9, 45.8, 44.2
- 1000: 45.8, 45.4, 47.4, 45.6, 46.8
- 2000: 45.5, 46.6, 46.5, 46.8, 45.5
- 3000: 46.2, 48.4, 46.3, 46.9, 45.8
- **Trend**: Highest value at **Ratio 0.2** and **Window Size 3000** (48.4).
### Key Observations
1. **AMC23 Dataset**:
- Values exceed the legend’s stated range (24–48), reaching **89.0**. This suggests either a miscalibrated legend or an outlier.
- Performance improves with larger window sizes (e.g., 3000) and mid-range ratios (0.3–0.4).
2. **AIME24 Dataset**:
- Consistent performance across ratios, with a peak at **Ratio 0.3** and **Window Size 2000** (49.3).
3. **GPQA_D Dataset**:
- Values cluster around 45–48, with a notable peak at **Ratio 0.2** and **Window Size 3000** (48.4).
4. **Legend Discrepancy**:
- The legend’s upper bound (48) does not align with the AMC23 data (89.0), indicating a potential error in the visualization.
### Interpretation
- **Model Performance**: R1-Llama shows varying effectiveness across datasets. AMC23 yields the highest Pass@1 scores, suggesting it is the most favorable for this model configuration.
- **Optimal Parameters**:
- For **AIME24** and **GPQA_D**, mid-range ratios (0.3–0.4) and larger window sizes (2000–3000) maximize performance.
- **AIME25** exhibits lower overall performance, with minimal improvement beyond **Ratio 0.3**.
- **Legend Issue**: The AMC23 data’s extreme values (e.g., 89.0) contradict the legend’s 24–48 range, raising questions about data normalization or visualization accuracy.
- **Trend Consistency**: Larger window sizes generally correlate with higher performance, but this is not universal (e.g., AIME25 shows no improvement beyond 1000).
This analysis highlights the importance of dataset-specific tuning for R1-Llama and underscores potential visualization inconsistencies in the provided heatmaps.