## Line Chart: Distances vs. Step Number for Different Model Variants
### Overview
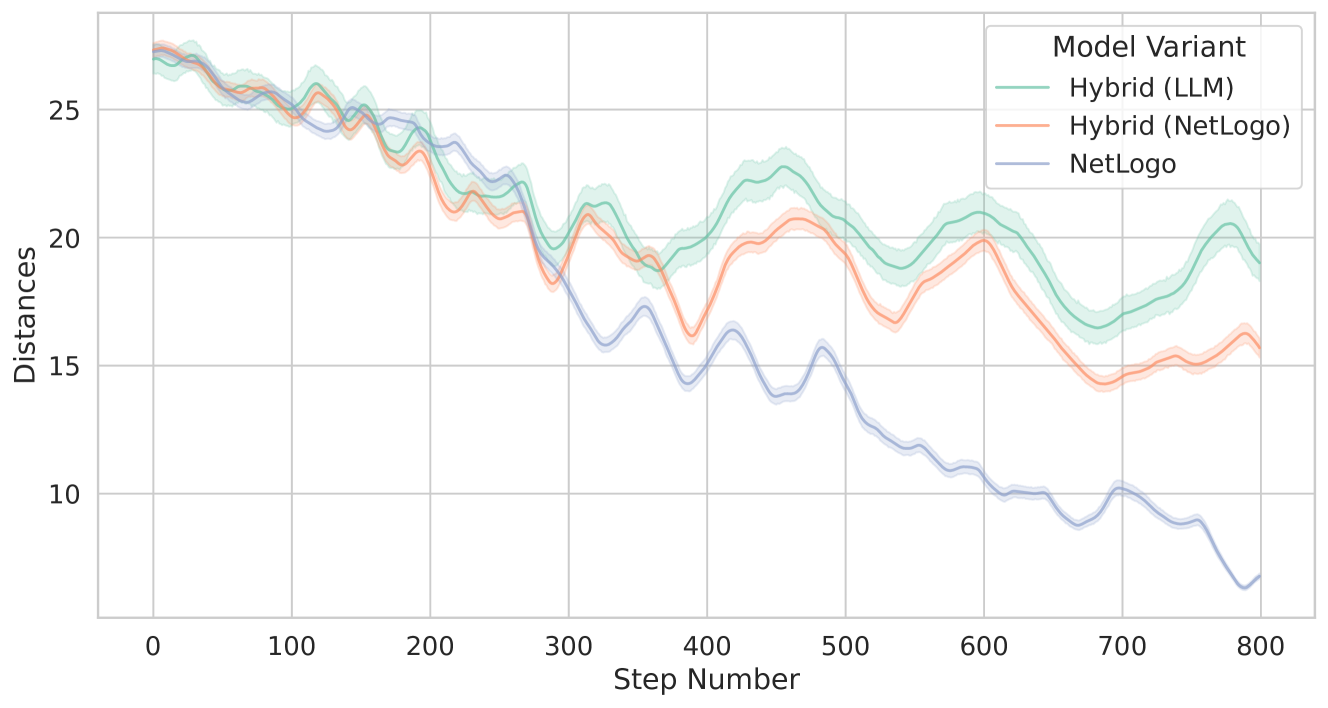
The image is a line chart comparing the "Distances" metric over "Step Number" for three different model variants: "Hybrid (LLM)", "Hybrid (NetLogo)", and "NetLogo". The chart displays the trend of each model's performance with shaded regions indicating variability or uncertainty.
### Components/Axes
* **X-axis:** "Step Number", ranging from 0 to 800 in increments of 100.
* **Y-axis:** "Distances", ranging from 10 to 25 in increments of 5.
* **Legend (Top-Right):**
* "Hybrid (LLM)" - Light Green line with light green shaded region.
* "Hybrid (NetLogo)" - Light Orange line with light orange shaded region.
* "NetLogo" - Light Blue line with light blue shaded region.
### Detailed Analysis
* **Hybrid (LLM) - Light Green:**
* The line starts at approximately 27 at step 0.
* The line decreases to approximately 20 at step 300.
* The line then increases to approximately 22 at step 600.
* The line then decreases to approximately 20 at step 800.
* **Hybrid (NetLogo) - Light Orange:**
* The line starts at approximately 26 at step 0.
* The line decreases to approximately 19 at step 300.
* The line then increases to approximately 21 at step 500.
* The line then decreases to approximately 16 at step 800.
* **NetLogo - Light Blue:**
* The line starts at approximately 26 at step 0.
* The line decreases to approximately 16 at step 300.
* The line then decreases to approximately 7 at step 800.
### Key Observations
* All three models start with similar "Distances" values around 26-27 at step 0.
* The "NetLogo" model shows a more significant and consistent decrease in "Distances" compared to the other two models.
* The "Hybrid (LLM)" and "Hybrid (NetLogo)" models exhibit more fluctuation, with periods of increase and decrease in "Distances".
* The shaded regions around each line indicate the variability or uncertainty in the "Distances" values for each model at each step number.
### Interpretation
The chart suggests that the "NetLogo" model performs differently compared to the hybrid models. The consistent decrease in "Distances" for the "NetLogo" model could indicate a more stable or efficient learning process, or a different behavior pattern compared to the hybrid models. The fluctuations in the "Hybrid (LLM)" and "Hybrid (NetLogo)" models could be due to the integration of different components (LLM and NetLogo), leading to more complex dynamics. The shaded regions provide insight into the reliability of the data, with wider regions indicating more variability in the results. Further analysis would be needed to understand the specific context of "Distances" and "Step Number" to draw more concrete conclusions about the models' performance.