\n
## Line Chart: Distance vs. Step Number for Different Model Variants
### Overview
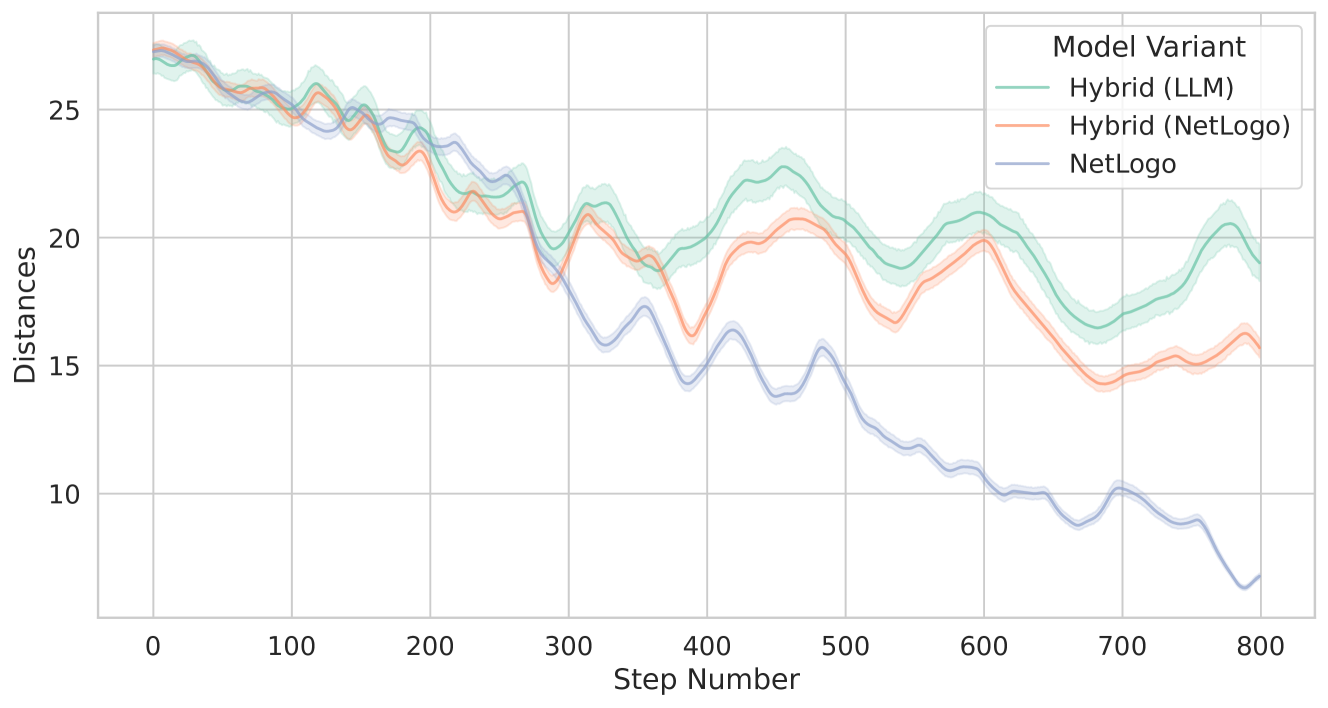
This line chart depicts the relationship between 'Step Number' and 'Distances' for three different 'Model Variants': Hybrid (LLM), Hybrid (NetLogo), and NetLogo. The chart appears to track the evolution of distances over a series of steps, potentially representing a simulation or iterative process.
### Components/Axes
* **X-axis:** "Step Number", ranging from approximately 0 to 800.
* **Y-axis:** "Distances", ranging from approximately 8 to 26.
* **Legend:** Located in the top-right corner, identifying the three data series:
* Hybrid (LLM) - represented by a green line.
* Hybrid (NetLogo) - represented by a peach/orange line.
* NetLogo - represented by a blue line.
* **Gridlines:** Present to aid in reading values.
### Detailed Analysis
The chart displays three distinct lines, each representing a different model variant.
* **NetLogo (Blue Line):** This line starts at approximately 26 at Step Number 0. It exhibits a generally decreasing trend, with significant dips around Step Numbers 200, 500, and 700. The line reaches a minimum distance of approximately 7 at Step Number 780. The trend is largely downward, with some oscillations.
* Step 0: ~26
* Step 100: ~24
* Step 200: ~18
* Step 300: ~16
* Step 400: ~15
* Step 500: ~13
* Step 600: ~11
* Step 700: ~9
* Step 780: ~7
* **Hybrid (NetLogo) (Peach/Orange Line):** This line begins at approximately 25 at Step Number 0. It shows a more fluctuating pattern than the NetLogo line, with peaks and valleys. It generally decreases until around Step Number 200, then oscillates between approximately 18 and 22.
* Step 0: ~25
* Step 100: ~24
* Step 200: ~20
* Step 300: ~19
* Step 400: ~20
* Step 500: ~21
* Step 600: ~20
* Step 700: ~19
* Step 780: ~16
* **Hybrid (LLM) (Green Line):** This line starts at approximately 25 at Step Number 0. It exhibits the most significant fluctuations of the three lines, with a wide range of distances. It generally decreases until around Step Number 200, then oscillates between approximately 18 and 24.
* Step 0: ~25
* Step 100: ~24
* Step 200: ~21
* Step 300: ~20
* Step 400: ~21
* Step 500: ~23
* Step 600: ~22
* Step 700: ~21
* Step 780: ~20
### Key Observations
* The NetLogo model consistently exhibits the lowest distances, particularly towards the end of the simulation (Step Number 780).
* The Hybrid (LLM) model shows the greatest variability in distances throughout the simulation.
* All three models show a general decreasing trend in distances up to approximately Step Number 200, after which they enter a period of oscillation.
* The Hybrid (NetLogo) model appears to be more stable than the Hybrid (LLM) model, but less effective at minimizing distances than the NetLogo model.
### Interpretation
The chart suggests that the NetLogo model is most effective at reducing distances over the simulated steps, while the Hybrid (LLM) model is the least stable. The initial decrease in distances for all models could represent a period of rapid learning or convergence. The subsequent oscillations might indicate a dynamic equilibrium or ongoing adjustments within the models. The differences in behavior between the models could be attributed to the underlying algorithms or parameters used in each approach. The data suggests that while hybrid approaches can offer some benefits, a pure NetLogo implementation may be more efficient in this specific context. The large fluctuations in the Hybrid (LLM) model could indicate sensitivity to initial conditions or a more complex interaction between the LLM and NetLogo components. Further investigation would be needed to understand the specific mechanisms driving these observed trends.