## Line Graph: Performance Comparison of Model Variants Over Steps
### Overview
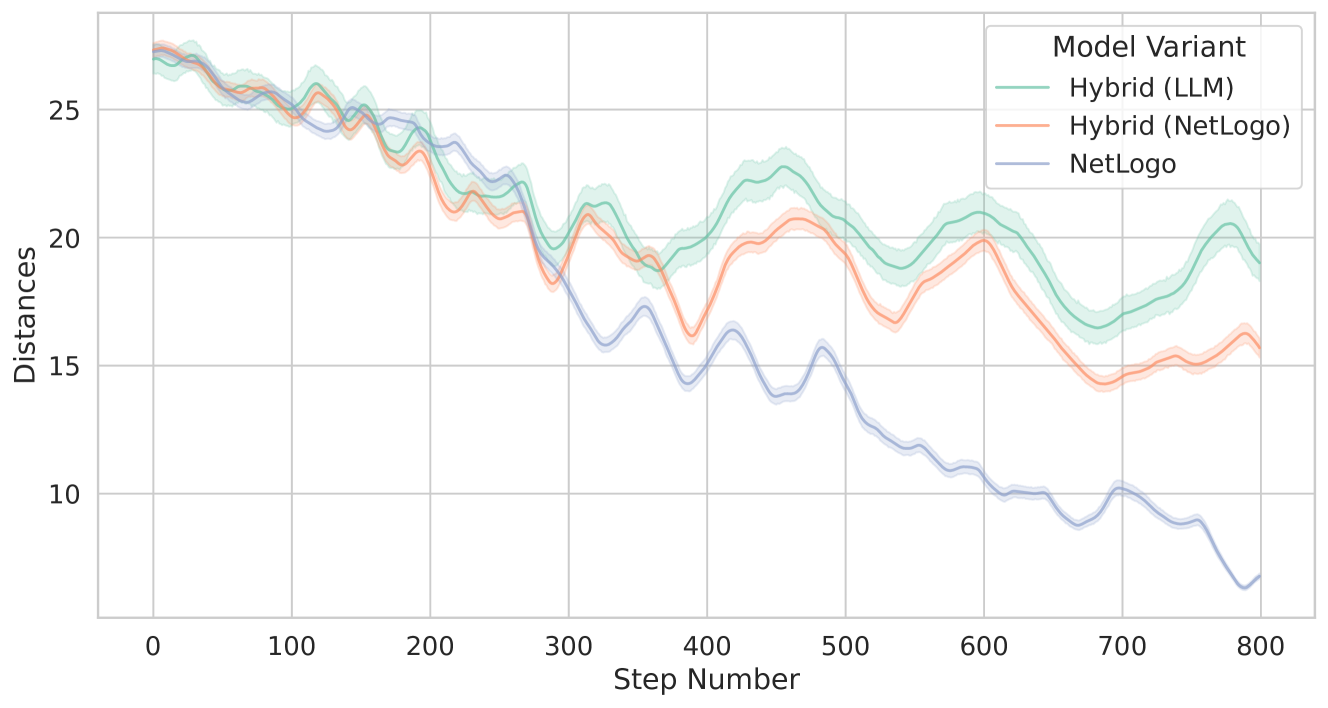
The image depicts a line graph comparing the performance of three model variants (Hybrid LLM, Hybrid NetLogo, and NetLogo) across 800 steps. The y-axis measures "Distances" (0–25), while the x-axis represents "Step Number" (0–800). All three lines begin near 27 on the y-axis but diverge significantly over time.
### Components/Axes
- **X-axis (Step Number)**: Labeled "Step Number," ranging from 0 to 800 in increments of 100.
- **Y-axis (Distances)**: Labeled "Distances," ranging from 0 to 25 in increments of 5.
- **Legend**: Located in the top-right corner, with three entries:
- **Green**: Hybrid (LLM)
- **Orange**: Hybrid (NetLogo)
- **Blue**: NetLogo
- **Lines**:
- **Green (Hybrid LLM)**: Starts at ~27, dips to ~18 at step 300, then fluctuates between ~18–22.
- **Orange (Hybrid NetLogo)**: Starts at ~27, drops to ~14 at step 300, then fluctuates between ~14–20.
- **Blue (NetLogo)**: Starts at ~27, plunges to ~6 at step 300, then fluctuates between ~8–12.
### Detailed Analysis
1. **Hybrid (LLM) [Green]**:
- Initial value: ~27 (step 0).
- Sharp decline to ~18 by step 300.
- Post-step 300: Oscillates between ~18–22, with peaks at steps 450 (~22) and 600 (~21).
- Final value: ~19 at step 800.
2. **Hybrid (NetLogo) [Orange]**:
- Initial value: ~27 (step 0).
- Steeper decline to ~14 by step 300.
- Post-step 300: Oscillates between ~14–20, with peaks at steps 450 (~20) and 600 (~19).
- Final value: ~15 at step 800.
3. **NetLogo [Blue]**:
- Initial value: ~27 (step 0).
- Sharpest decline to ~6 by step 300.
- Post-step 300: Fluctuates between ~8–12, with a low of ~7 at step 700 and a final value of ~5 at step 800.
### Key Observations
- **Divergence**: All models start at similar performance levels (~27) but diverge significantly after step 300.
- **NetLogo Degradation**: The blue line (NetLogo) shows the steepest and most sustained decline, ending at ~5, far below the hybrids.
- **Hybrid Stability**: Both hybrid models (green and orange) exhibit greater variability but maintain higher final values (~15–19) compared to NetLogo.
- **Fluctuations**: All lines show periodic oscillations, suggesting non-linear performance trends.
### Interpretation
The data suggests that **NetLogo** experiences the most significant performance degradation over time, potentially due to algorithmic limitations or sensitivity to step increments. In contrast, the **Hybrid (LLM)** and **Hybrid (NetLogo)** models demonstrate greater resilience, maintaining higher distances despite fluctuations. The hybrids’ oscillations may reflect adaptive mechanisms or trade-offs between efficiency and stability. Notably, the **Hybrid (LLM)** variant outperforms the **Hybrid (NetLogo)** in later steps, indicating that LLM integration might enhance long-term performance. The consistent divergence implies that model architecture (hybrid vs. standalone) plays a critical role in sustaining performance across extended steps.