## Line Chart: Hits@1 vs. Number of Rule Graph Nodes
### Overview
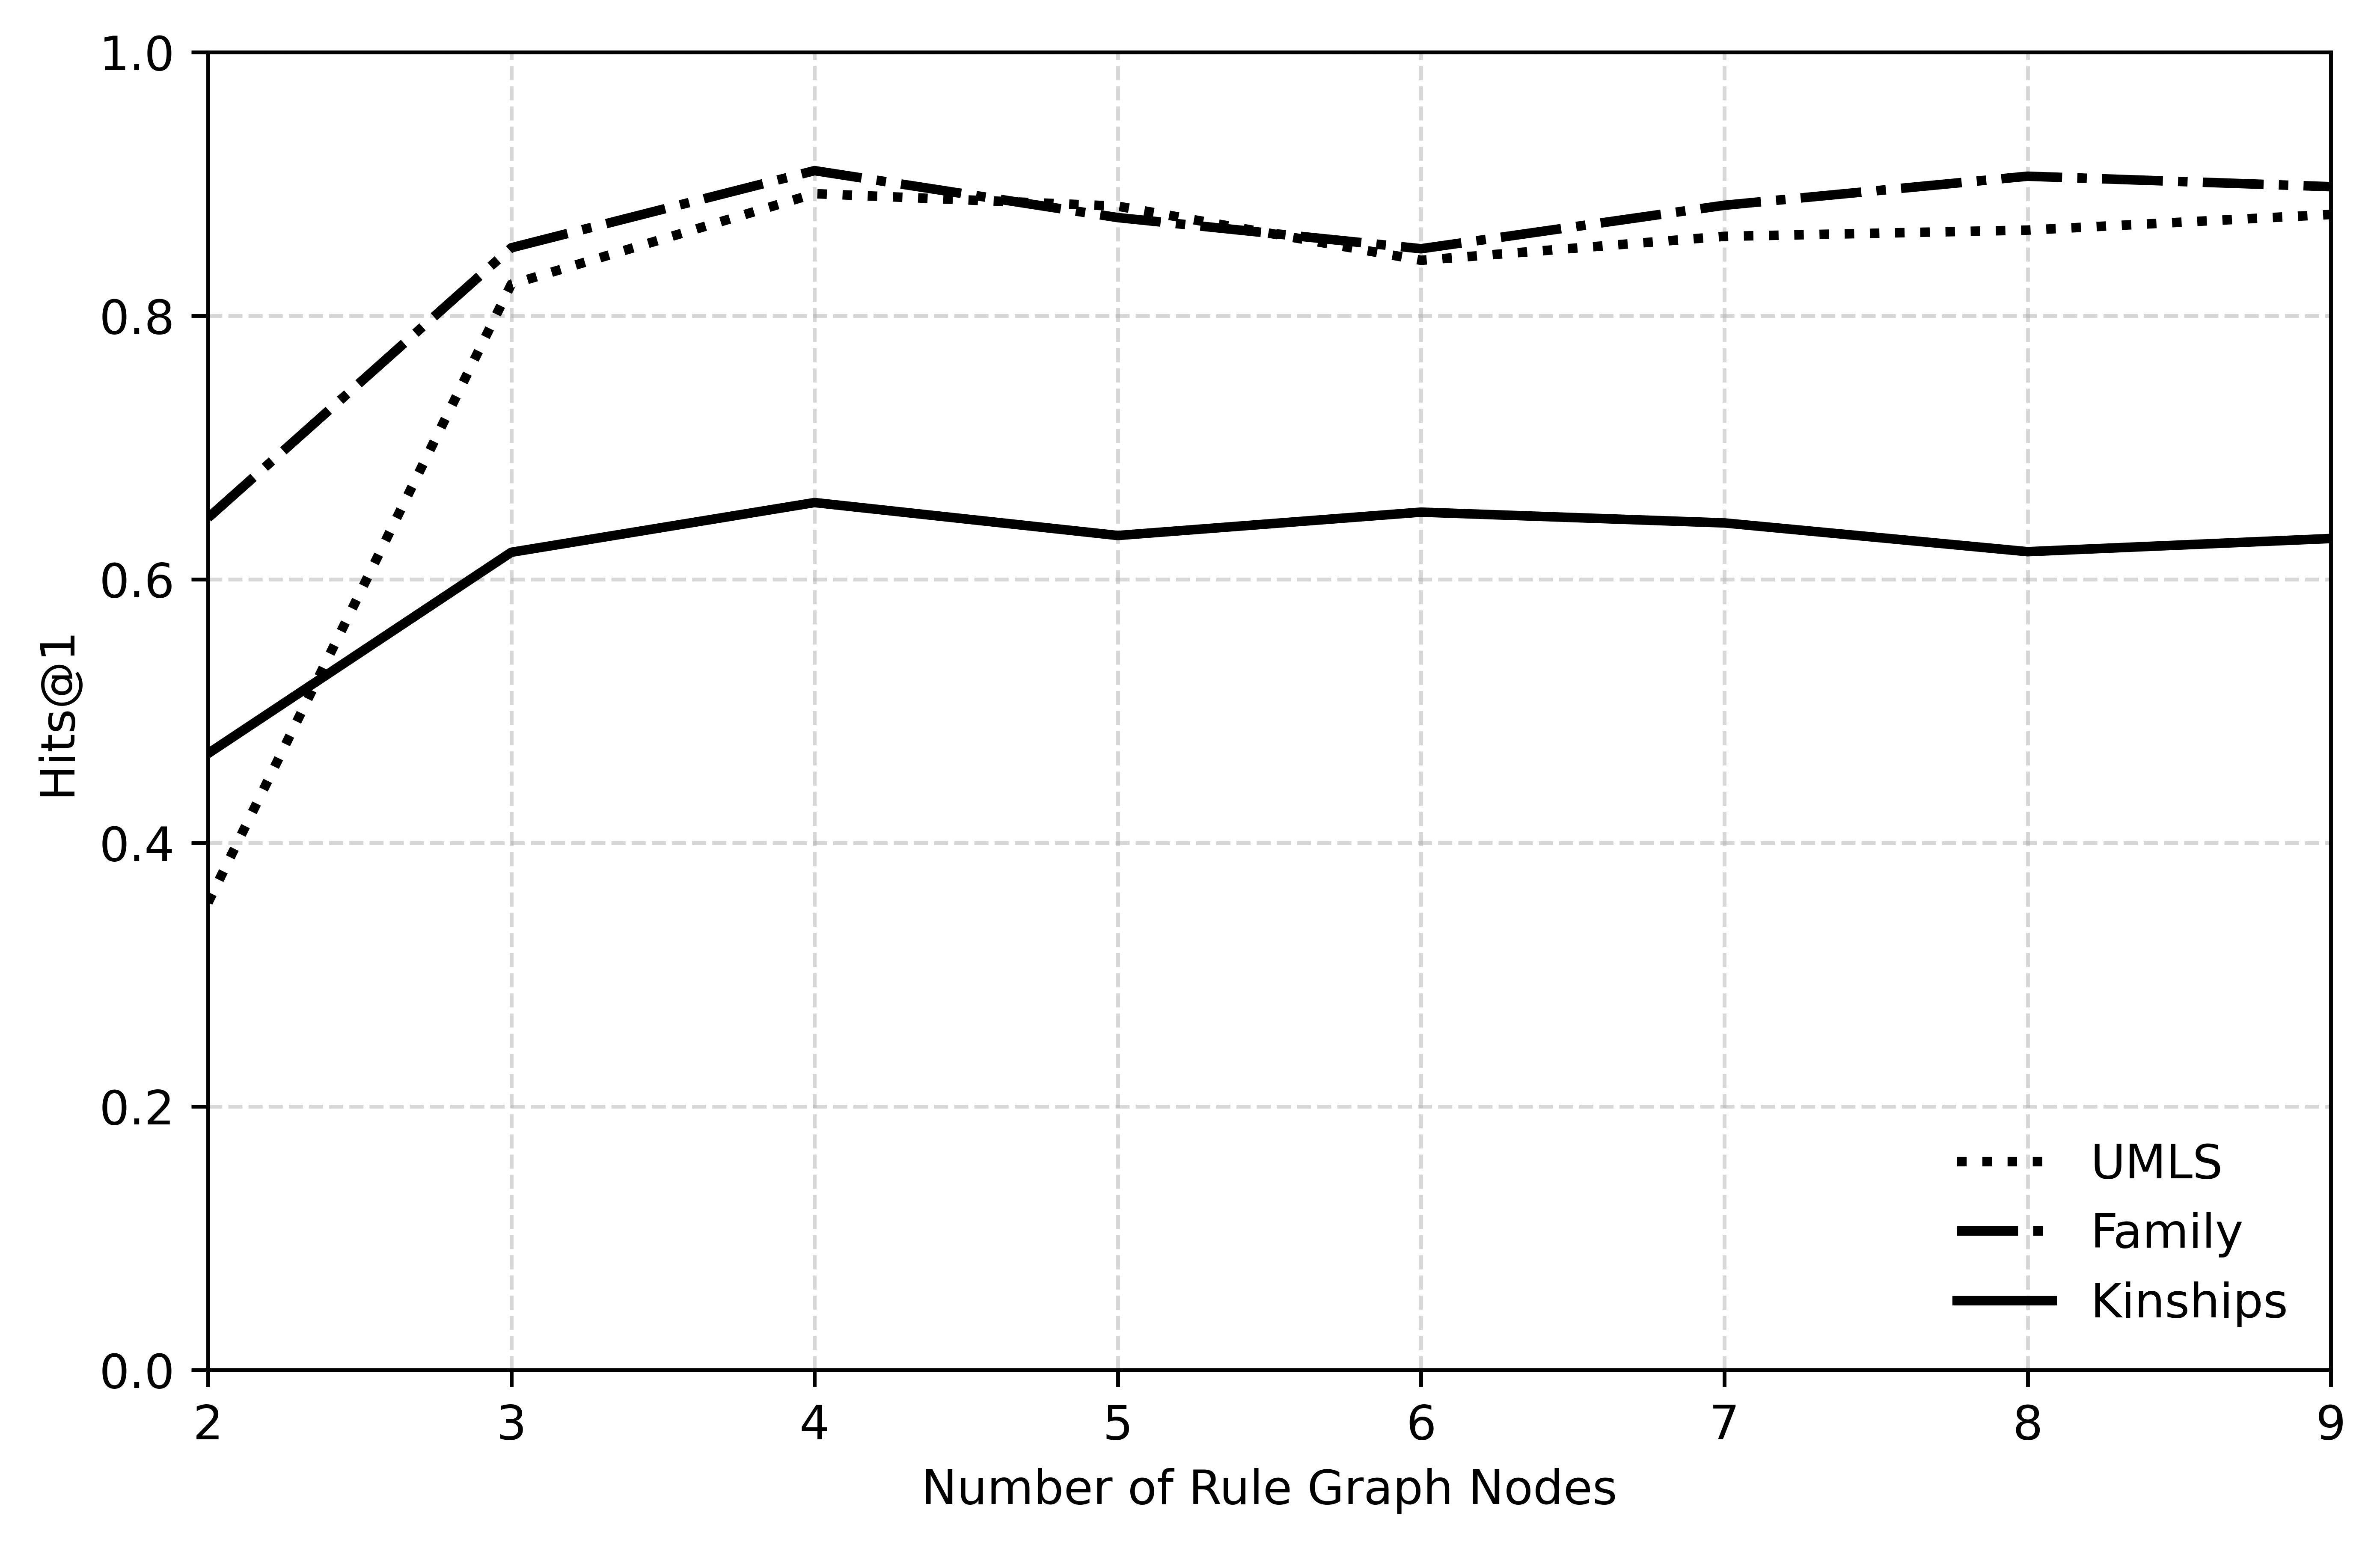
The image is a line chart comparing the "Hits@1" metric for three different datasets (UMLS, Family, and Kinships) against the "Number of Rule Graph Nodes." The chart displays how the Hits@1 score changes as the number of rule graph nodes increases from 2 to 9.
### Components/Axes
* **X-axis:** "Number of Rule Graph Nodes" with values ranging from 2 to 9.
* **Y-axis:** "Hits@1" with values ranging from 0.0 to 1.0, incrementing by 0.2.
* **Legend:** Located in the bottom-right corner, it identifies the three datasets:
* UMLS (black dotted line)
* Family (black dashed line)
* Kinships (black solid line)
### Detailed Analysis
* **UMLS (black dotted line):** The Hits@1 score increases sharply from approximately 0.35 at 2 nodes to around 0.82 at 3 nodes. It then continues to increase, but at a slower rate, reaching approximately 0.90 at 4 nodes. From 4 nodes to 9 nodes, the score fluctuates slightly, ending at approximately 0.88.
* 2 Nodes: ~0.35
* 3 Nodes: ~0.82
* 4 Nodes: ~0.90
* 9 Nodes: ~0.88
* **Family (black dashed line):** The Hits@1 score increases rapidly from approximately 0.65 at 2 nodes to around 0.86 at 3 nodes. It peaks at approximately 0.92 at 4 nodes. From 4 nodes to 9 nodes, the score decreases slightly to approximately 0.90.
* 2 Nodes: ~0.65
* 3 Nodes: ~0.86
* 4 Nodes: ~0.92
* 9 Nodes: ~0.90
* **Kinships (black solid line):** The Hits@1 score increases from approximately 0.48 at 2 nodes to around 0.62 at 3 nodes. It peaks at approximately 0.66 at 4 nodes. From 4 nodes to 9 nodes, the score fluctuates slightly, ending at approximately 0.63.
* 2 Nodes: ~0.48
* 3 Nodes: ~0.62
* 4 Nodes: ~0.66
* 9 Nodes: ~0.63
### Key Observations
* The "Family" dataset consistently achieves the highest Hits@1 scores across all numbers of rule graph nodes.
* The "Kinships" dataset consistently achieves the lowest Hits@1 scores across all numbers of rule graph nodes.
* All three datasets show a significant increase in Hits@1 score between 2 and 4 rule graph nodes.
* After 4 rule graph nodes, the Hits@1 scores for all datasets tend to plateau or fluctuate slightly.
### Interpretation
The chart suggests that increasing the number of rule graph nodes initially improves the Hits@1 score for all three datasets. However, after a certain point (around 4 nodes), adding more nodes does not significantly improve the performance and may even lead to slight decreases. The "Family" dataset appears to be the most effective for this task, while "Kinships" is the least effective, based on the Hits@1 metric. The performance differences between the datasets may be due to the inherent characteristics and complexity of each dataset. The plateauing effect suggests that there is a limit to how much the rule graph can improve performance for these datasets.