## Line Chart: Hits@1 vs. Number of Rule Graph Nodes
### Overview
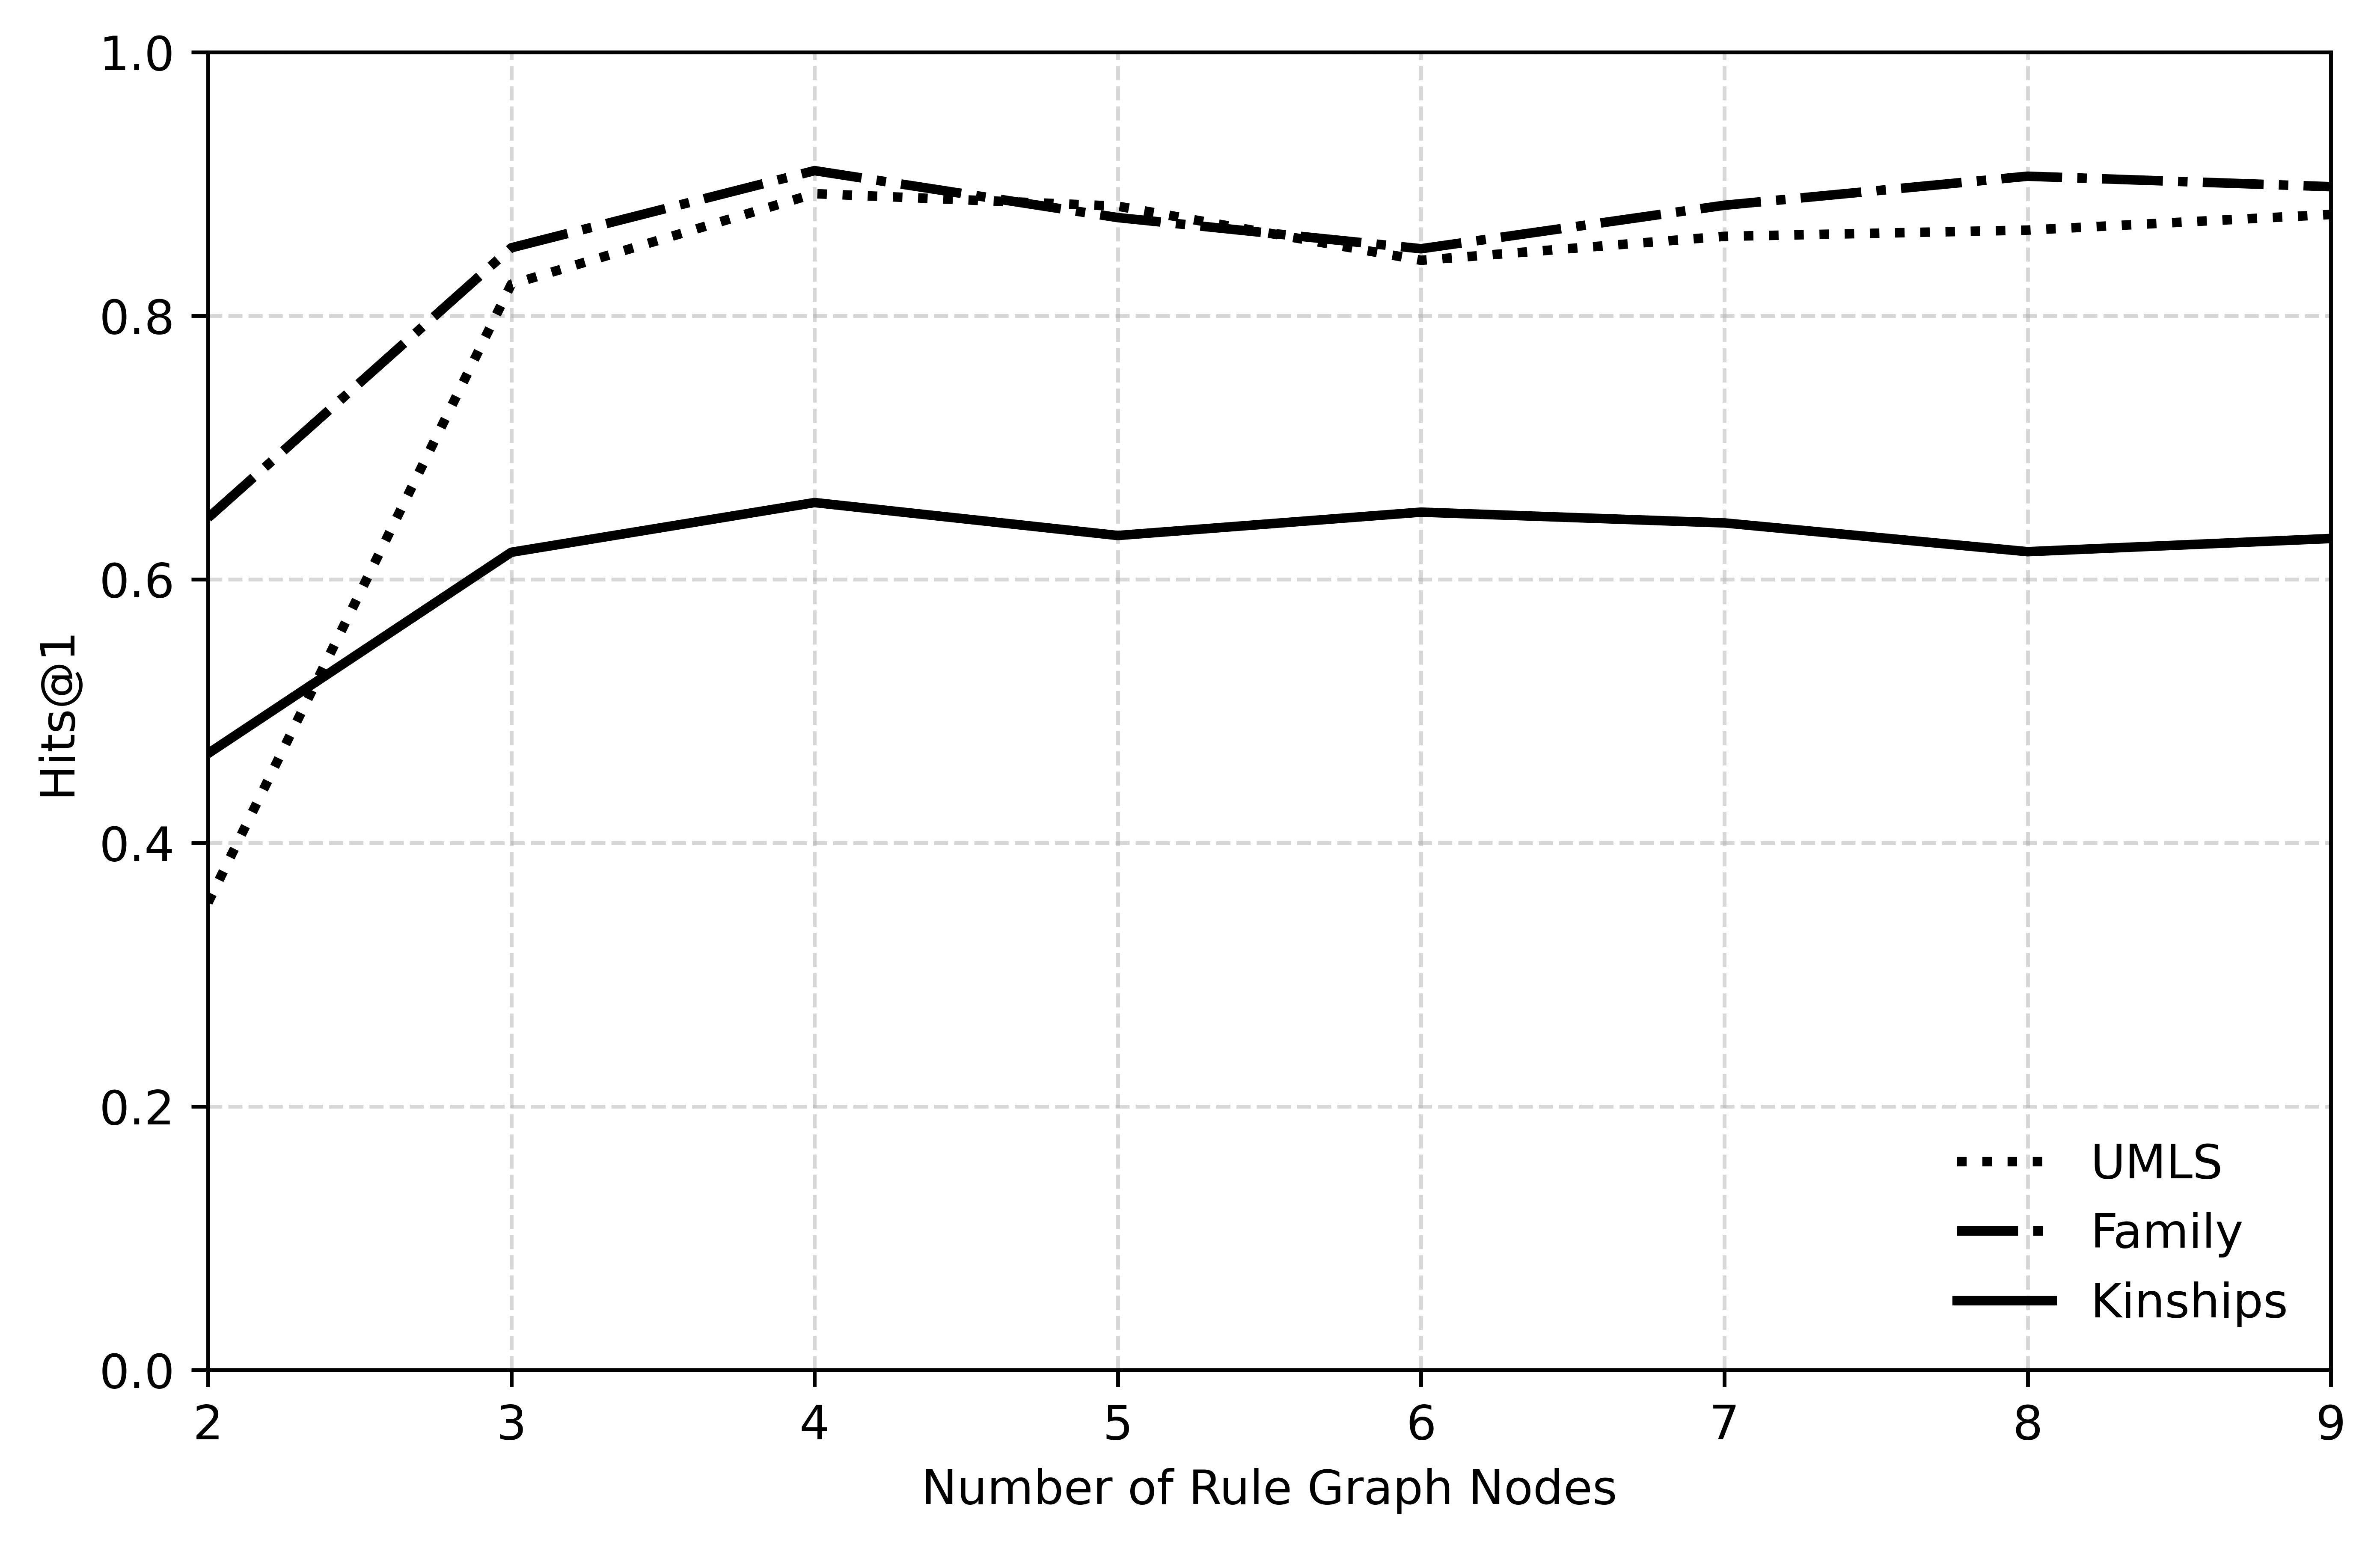
This image is a line chart illustrating the performance (measured as "Hits@1") of three distinct datasets—UMLS, Family, and Kinships—as the "Number of Rule Graph Nodes" increases from 2 to 9. The chart demonstrates that increasing the number of nodes generally improves performance up to a point (typically 4 nodes), after which the performance plateaus or fluctuates slightly.
### Components/Axes
* **X-Axis:** Labeled "Number of Rule Graph Nodes". The scale is discrete, ranging from 2 to 9.
* **Y-Axis:** Labeled "Hits@1". The scale is continuous, ranging from 0.0 to 1.0, with major grid lines at 0.2 intervals.
* **Legend:** Located in the bottom-right quadrant.
* **Dotted line:** UMLS
* **Dash-dotted line:** Family
* **Solid line:** Kinships
* **Grid:** Light gray dashed vertical and horizontal grid lines are present to assist in reading data points.
### Detailed Analysis
#### Data Series Trends and Values
*All values are approximate based on visual inspection of the chart.*
**1. UMLS (Dotted Line)**
* **Trend:** Shows a sharp upward trajectory from 2 to 3 nodes, peaks at 4 nodes, experiences a slight dip at 6 nodes, and then stabilizes.
* **Data Points:**
* 2 nodes: ~0.36
* 3 nodes: ~0.82
* 4 nodes: ~0.90 (Peak)
* 5 nodes: ~0.88
* 6 nodes: ~0.84
* 7 nodes: ~0.86
* 8 nodes: ~0.87
* 9 nodes: ~0.88
**2. Family (Dash-dotted Line)**
* **Trend:** Starts at a relatively high value, increases sharply to 3 nodes, peaks at 4 nodes, dips at 6 nodes, and recovers to a high plateau.
* **Data Points:**
* 2 nodes: ~0.64
* 3 nodes: ~0.85
* 4 nodes: ~0.91 (Peak)
* 5 nodes: ~0.88
* 6 nodes: ~0.85
* 7 nodes: ~0.88
* 8 nodes: ~0.91
* 9 nodes: ~0.90
**3. Kinships (Solid Line)**
* **Trend:** Shows a moderate upward trend from 2 to 4 nodes, followed by a relatively flat performance with minor fluctuations for the remainder of the range. It consistently underperforms compared to the other two datasets.
* **Data Points:**
* 2 nodes: ~0.47
* 3 nodes: ~0.62
* 4 nodes: ~0.66 (Peak)
* 5 nodes: ~0.63
* 6 nodes: ~0.65
* 7 nodes: ~0.64
* 8 nodes: ~0.62
* 9 nodes: ~0.63
### Key Observations
* **Optimal Complexity:** For all three datasets, the performance peaks at 4 nodes. Increasing the number of nodes beyond 4 does not yield significant performance gains and, in some cases (like the dip at 6 nodes), results in a slight performance degradation.
* **Performance Gap:** There is a distinct performance tiering. "Family" and "UMLS" perform significantly better (Hits@1 > 0.8) than "Kinships" (Hits@1 < 0.7).
* **Consistency:** The "Kinships" dataset is the most stable after 4 nodes, showing very little variance, whereas "UMLS" and "Family" show more volatility between 4 and 6 nodes.
### Interpretation
The data suggests that for these specific rule-based models, there is a "sweet spot" for graph complexity.
* **Diminishing Returns:** The sharp increase in performance between 2 and 3 nodes indicates that the models require a minimum level of structural complexity to capture the underlying relationships in the data effectively.
* **Overfitting/Complexity Penalty:** The consistent dip observed across all three datasets at 6 nodes suggests a potential complexity penalty. This could indicate that as the number of nodes increases, the model may be overfitting to the training data or that the rule generation process becomes less efficient, leading to a slight drop in predictive accuracy (Hits@1).
* **Dataset Characteristics:** The "Kinships" dataset appears to be inherently more difficult or less structured for this specific model architecture, as it fails to reach the high accuracy levels achieved by "UMLS" and "Family," regardless of the number of nodes used.