## Line Graph: Performance vs. Rule Graph Complexity
### Overview
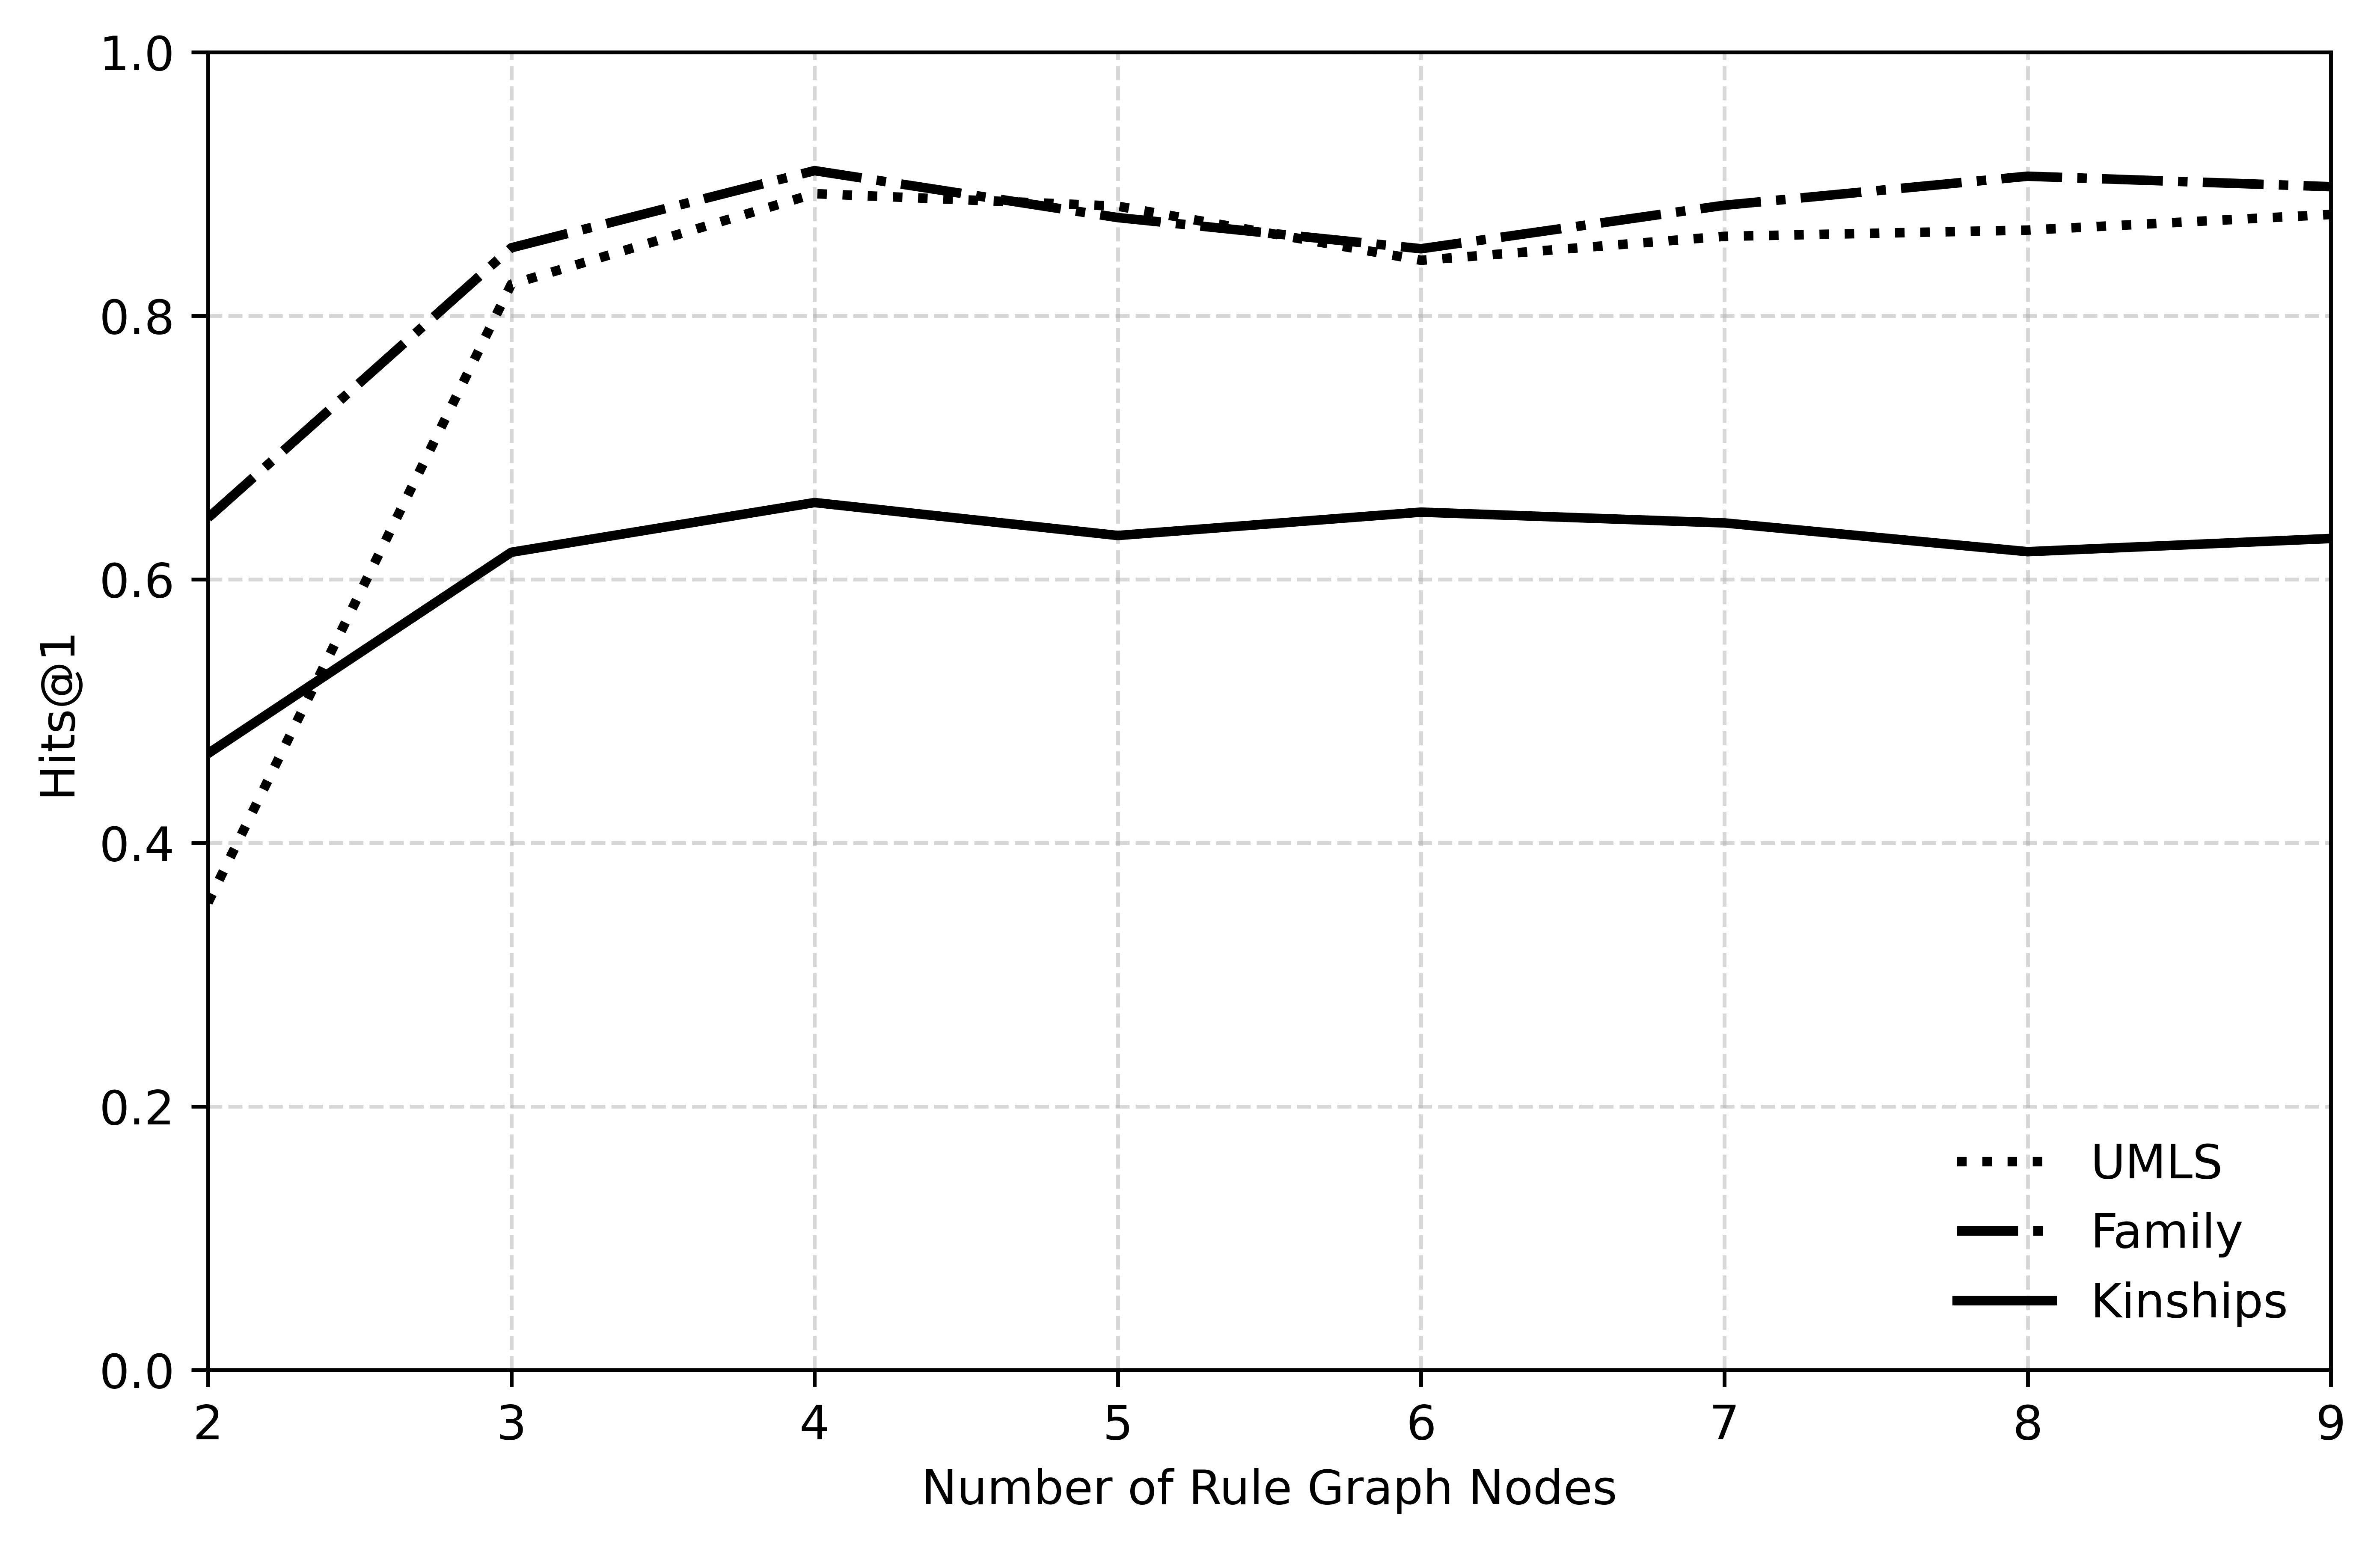
The image is a line graph comparing the performance of three different datasets or models (UMLS, Family, Kinships) as a function of increasing rule graph complexity. The performance metric is "Hits@1," and the complexity is measured by the "Number of Rule Graph Nodes."
### Components/Axes
* **X-Axis:** Labeled "Number of Rule Graph Nodes." It has discrete integer markers from 2 to 9.
* **Y-Axis:** Labeled "Hits@1." It is a continuous scale from 0.0 to 1.0, with major gridlines at intervals of 0.2.
* **Legend:** Located in the bottom-right corner of the plot area. It defines three line styles:
* `......` (dotted line): **UMLS**
* `-.-.` (dash-dot line): **Family**
* `______` (solid line): **Kinships**
* **Grid:** A light gray, dashed grid is present for both major x and y ticks.
### Detailed Analysis
**Trend Verification & Data Points (Approximate):**
1. **UMLS (Dotted Line):**
* **Trend:** Starts very low, exhibits a steep, near-linear increase from 2 to 3 nodes, then continues to rise more gradually to a peak at 4 nodes. After the peak, it shows a very slight, gradual decline and then a plateau.
* **Approximate Values:**
* Node 2: ~0.36
* Node 3: ~0.82
* Node 4: ~0.89 (Peak)
* Node 5: ~0.88
* Node 6: ~0.84
* Node 7: ~0.86
* Node 8: ~0.87
* Node 9: ~0.88
2. **Family (Dash-Dot Line):**
* **Trend:** Starts at a moderate level, increases steadily to a peak at 4 nodes, then experiences a slight dip at 6 nodes before recovering and stabilizing at a high level.
* **Approximate Values:**
* Node 2: ~0.65
* Node 3: ~0.85
* Node 4: ~0.91 (Peak)
* Node 5: ~0.88
* Node 6: ~0.85
* Node 7: ~0.88
* Node 8: ~0.90
* Node 9: ~0.90
3. **Kinships (Solid Line):**
* **Trend:** Starts at the lowest point among the three. Shows a steady, moderate increase from 2 to 4 nodes, then plateaus with minor fluctuations, remaining consistently below the other two series.
* **Approximate Values:**
* Node 2: ~0.47
* Node 3: ~0.62
* Node 4: ~0.66
* Node 5: ~0.63
* Node 6: ~0.65
* Node 7: ~0.64
* Node 8: ~0.62
* Node 9: ~0.63
### Key Observations
1. **Performance Hierarchy:** The "Family" dataset consistently achieves the highest Hits@1 scores across all node counts, followed closely by "UMLS" after 3 nodes. "Kinships" performs significantly worse than the other two.
2. **Diminishing Returns:** All three series show a clear pattern of diminishing returns. The most significant performance gains occur when increasing the number of nodes from 2 to 4. After 4 nodes, performance gains are minimal or non-existent, with lines plateauing or showing slight fluctuations.
3. **Convergence:** The performance of "UMLS" and "Family" converges after 3 nodes, with their lines running nearly parallel and within ~0.05 Hits@1 of each other from node 4 onward.
4. **Peak Performance:** Both "UMLS" and "Family" appear to reach their peak performance at 4 rule graph nodes. "Kinships" peaks at 4 nodes as well but at a much lower absolute value.
### Interpretation
This graph demonstrates the relationship between the structural complexity of a rule-based system (represented by graph node count) and its predictive accuracy (Hits@1) on three distinct knowledge domains or tasks.
* **Core Insight:** Increasing rule graph complexity is highly beneficial up to a point (around 4 nodes in this experiment), after which the accuracy benefits plateau. This suggests an optimal complexity threshold exists; adding more nodes beyond this yields little to no improvement and may increase computational cost without benefit.
* **Domain Difficulty:** The stark performance gap between "Kinships" and the other two datasets indicates that the kinship relation prediction task is fundamentally more challenging for the model or rule system being tested. The relationships may be more complex, noisier, or less explicitly captured by the rule graph structure compared to the domains covered by "UMLS" (likely medical terminology) and "Family."
* **Model Behavior:** The similar trajectories of "UMLS" and "Family" suggest the model handles these domains with comparable efficiency once a minimal complexity threshold (3-4 nodes) is met. The initial steep rise for UMLS implies it benefits most dramatically from the introduction of basic relational rules.