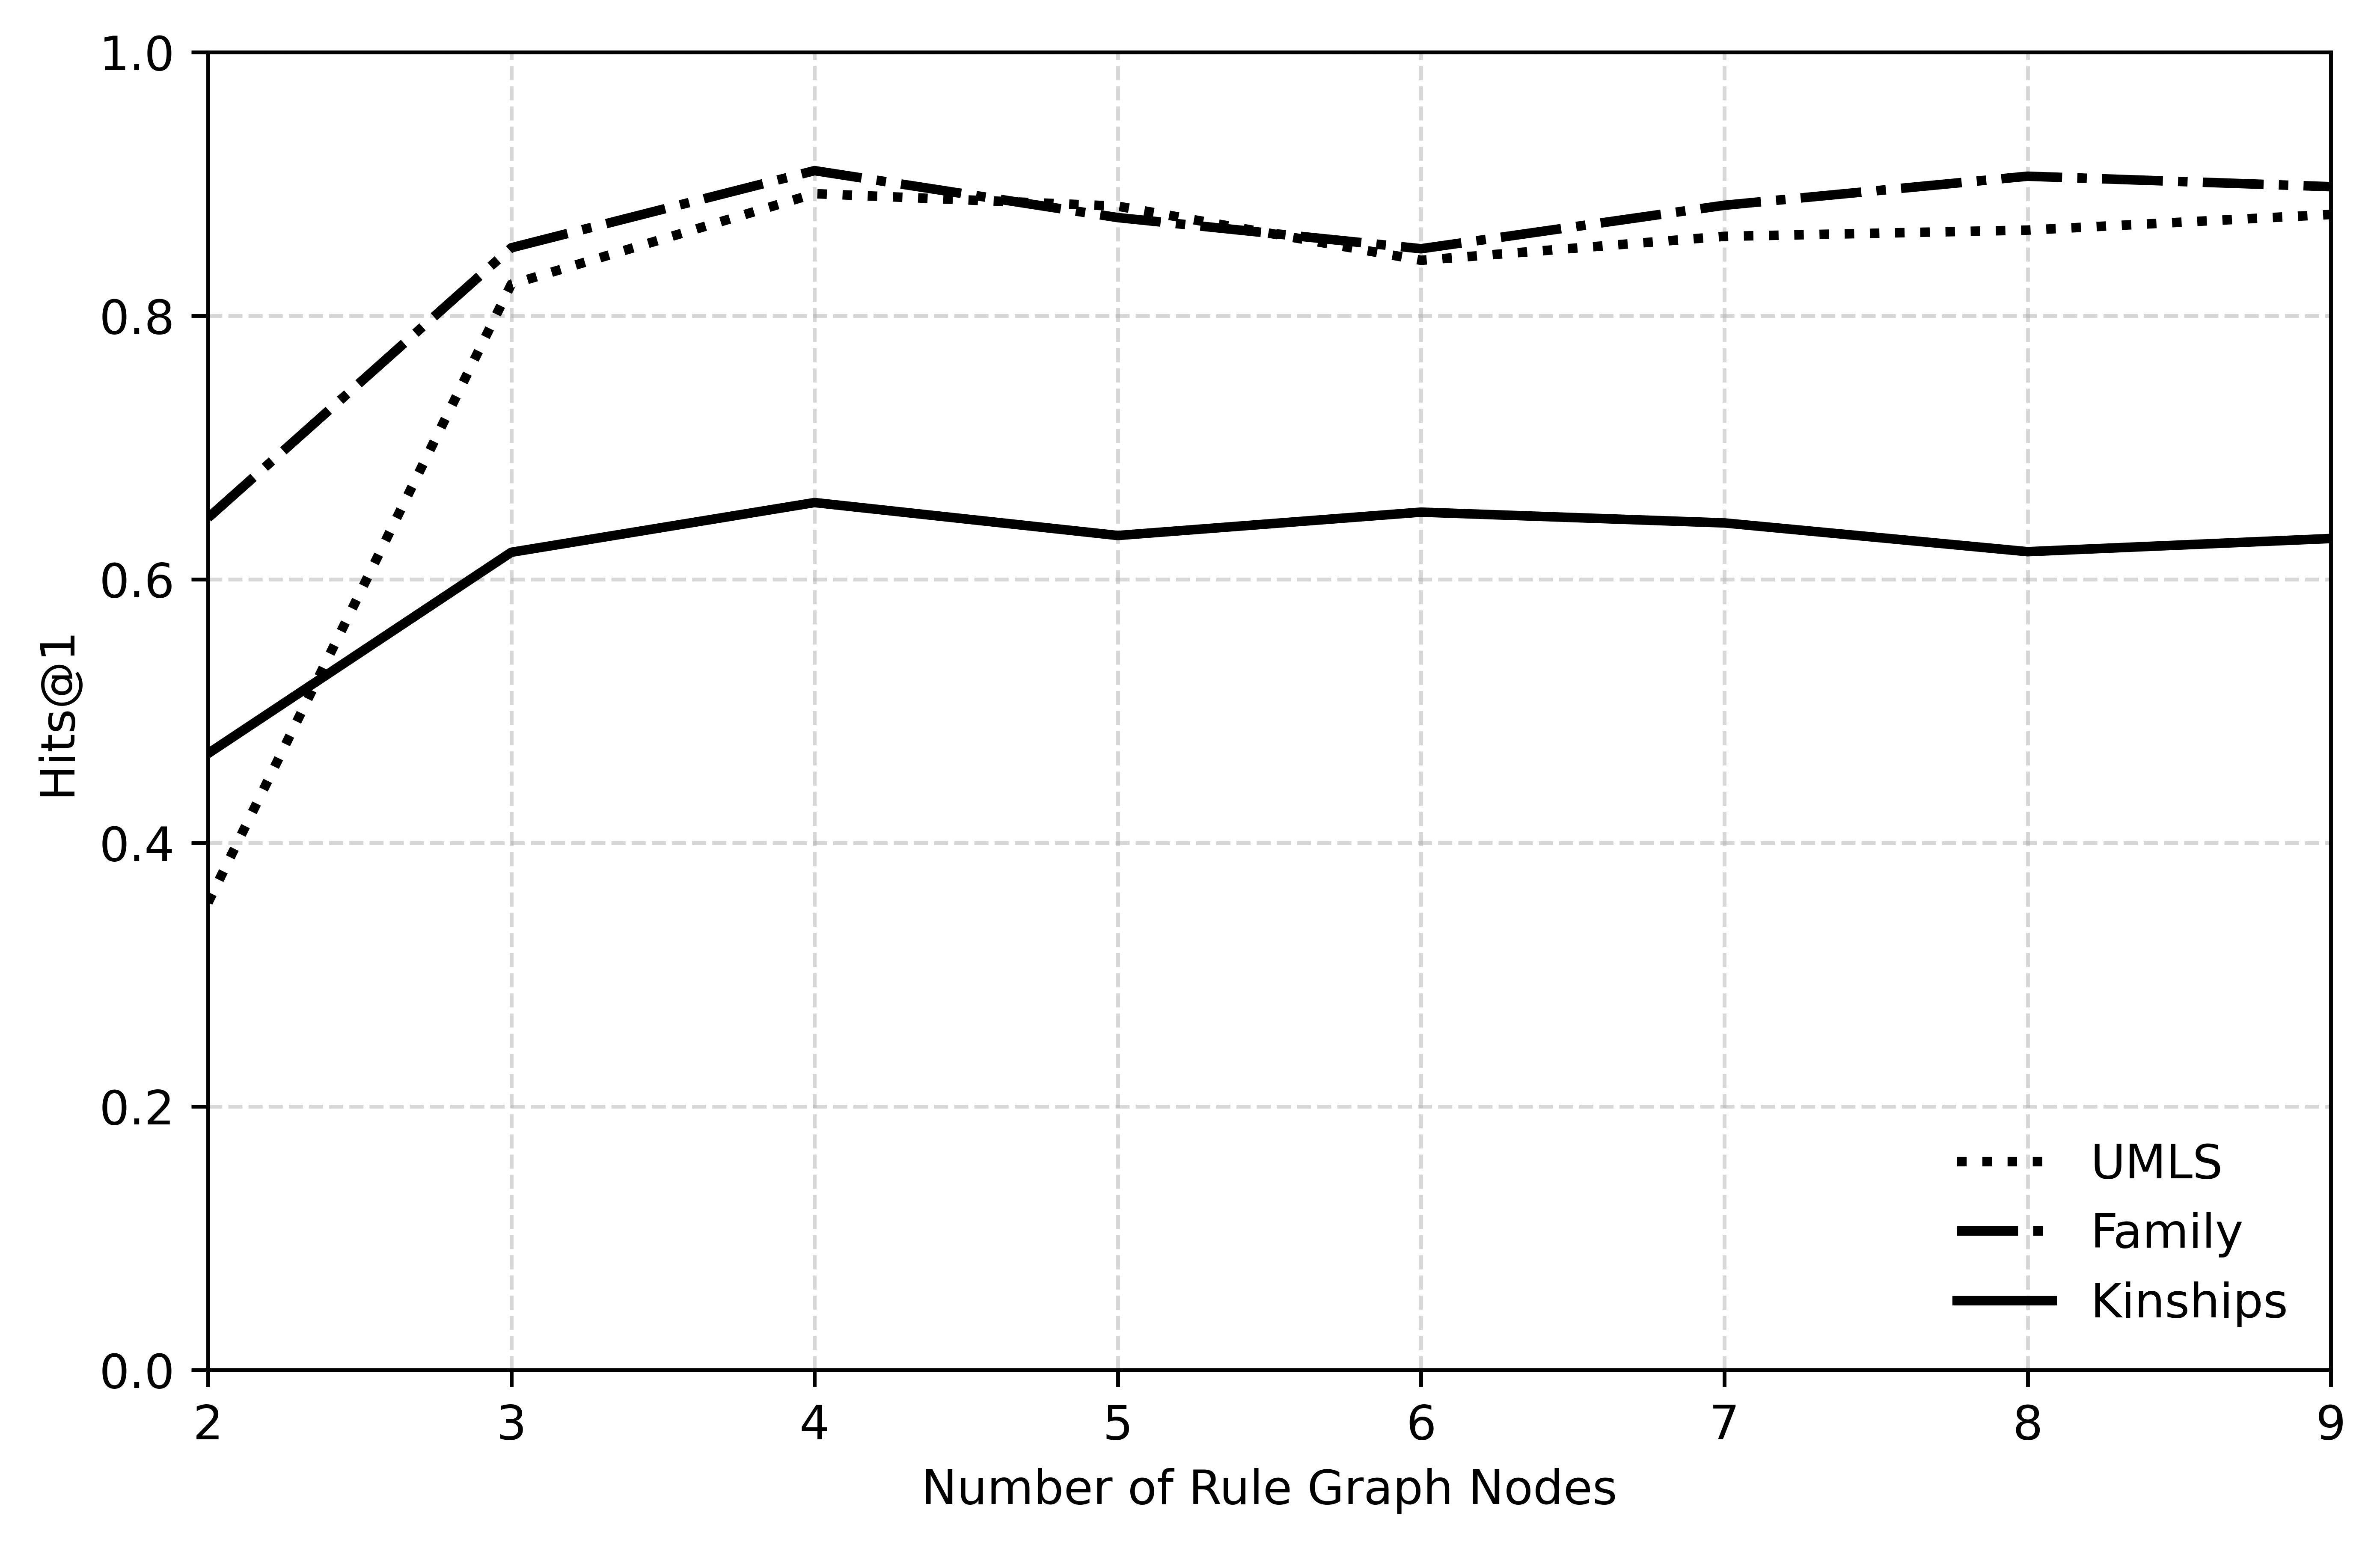
## Line Graph: Hits@1 vs. Number of Rule Graph Nodes
### Overview
The graph compares three data series (UMLS, Family, Kinships) across 8 data points, showing performance metrics (Hits@1) as the number of Rule Graph Nodes increases from 2 to 9. All values are normalized between 0.0 and 1.0.
### Components/Axes
- **X-axis**: "Number of Rule Graph Nodes" (integer values 2–9, evenly spaced)
- **Y-axis**: "Hits@1" (continuous scale from 0.0 to 1.0, increments of 0.2)
- **Legend**: Located in the bottom-right corner, with three entries:
- **Dotted line**: UMLS
- **Dashed line**: Family
- **Solid line**: Kinships
### Detailed Analysis
1. **UMLS (Dotted Line)**:
- Starts at ~0.35 (x=2), sharply rises to ~0.9 (x=4), then plateaus with minor fluctuations (~0.85–0.89) until x=9.
- Peaks at x=4 (0.9), then stabilizes near 0.88–0.89.
2. **Family (Dashed Line)**:
- Begins at ~0.5 (x=2), rises to ~0.65 (x=4), then fluctuates between ~0.6–0.66 until x=9.
- Peaks at x=4 (0.65), then declines slightly to 0.63 at x=9.
3. **Kinships (Solid Line)**:
- Starts at ~0.65 (x=2), peaks at ~0.9 (x=4), then declines to ~0.85 (x=6), stabilizing at ~0.88 by x=9.
- Peaks at x=4 (0.9), then dips to 0.85 at x=6 before recovering.
### Key Observations
- **UMLS** consistently outperforms other series, maintaining the highest Hits@1 across all node counts.
- **Family** shows the lowest performance, with a modest rise followed by a decline.
- **Kinships** matches UMLS at x=4 (0.9) but declines afterward, though remains above Family.
- Lines intersect at x=3 (Family and Kinships both at ~0.62) and x=8 (Kinships briefly surpasses UMLS at 0.9 vs. 0.88).
### Interpretation
- **Performance Trends**:
- UMLS demonstrates robust scalability, with diminishing returns after x=4.
- Family’s performance plateaus early, suggesting limited benefit from additional nodes.
- Kinships’ early peak implies optimal performance at moderate node counts, with later degradation.
- **Cross-Series Relationships**:
- UMLS and Kinships dominate, while Family lags, indicating potential inefficiencies in its methodology.
- The convergence of Kinships and UMLS at x=4 suggests overlapping effectiveness at this node count.
- **Anomalies**:
- Kinships’ sharp decline after x=4 contrasts with UMLS’s stability, hinting at sensitivity to node count increases.
- Family’s late-stage dip (x=8–9) may reflect overfitting or diminishing returns.
This analysis highlights UMLS as the most reliable performer, with Kinships offering competitive results at lower node counts. Family’s trajectory warrants further investigation into its limitations.